Download
1 / 15
200 likes | 738 Views
Design and Operation of a Bench Scale Continuous Flow Waste Water Treatment Plant. By: Stephen Mirabello and Allison Muehe. Contents. Objective Setup of Batch verses Continuous System Parameter Values Process Controller States Turbidity Turbidity Equations Results and Summary of Data

E N D
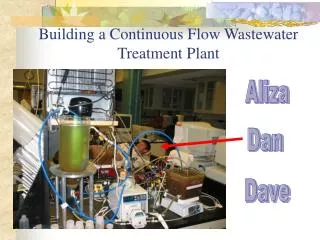
Design and Operation of a Bench Scale Continuous Flow Waste Water Treatment Plant By: Stephen Mirabello and Allison Muehe
Contents • Objective • Setup of Batch verses Continuous System • Parameter Values • Process Controller States • Turbidity • Turbidity Equations • Results and Summary of Data • Notes • Performance Diagram • Conclusions and Suggestions
Objective • Turn bench scale batch WWTP into a continuous flow WWTP • Of 4 conditions, find the system with the lowest turbidity measurement for the clarifier effluent
Waste Batch System Tap Water Refrigerator Drain Air Flow Stirrer
Peristaltic Pump Waste Continuous Flow System Tap Water Refrigerator Mixer On/Off Final Product Air Flow Centrifugal Pump Drain Stirrer Sludge Recycle On/Off
Process Controller States • States for No Stirring in Clarifier • States for Stirring in Clarifier
Turbidity • Definition • NTU, or Nephelometric Turbidity Units • A turbidimeter works by estimating how light is scattered by suspended particulate material in the water • Secchi Disk • Measurements • Trials • 7 vials: 1 standard of distilled water, 3 effluent samples, and 3 reactor samples • 4 trials: 3 measurements, 1 each day for 3 days • Steps to minimize variability • Process Controller States • With no Clarifier Mixing • During “Centrifugal Pump Off” state • At t = 300 seconds • With Clarifier Mixing • During “Centrifugal Pump Off” state • At t = 200 seconds • Data • the actual turbidity reading • percent of TSS removal
Notes • The percent removal and effluent graphs are not correlated. • Small changes in percent removal values. May be caused by measurement error and not actual differences in clarifier design. • Difficult to make conclusions due to variations in reactor turbidity • Also have to account sludge generation and balance
Performance Diagram • Data could be accurate but in a different part of the graph • As Detention Time increases, approaches a value asymptotically • Curve also moves upward as TSS increases • TSS of our reactor was 960 – 1800 mg/L • This TSS correlates to a high removal rate
Conclusions and Suggestions • Able to operate a continuous flow reactor • See how sludge recycle is affected by changing system parameters • Need to fix reactor TSS to obtain better results • Change clarifier depth to obtain more applicable results • Create a performance curve to create a reference for TSS and detention time