Download
1 / 33
330 likes | 335 Views
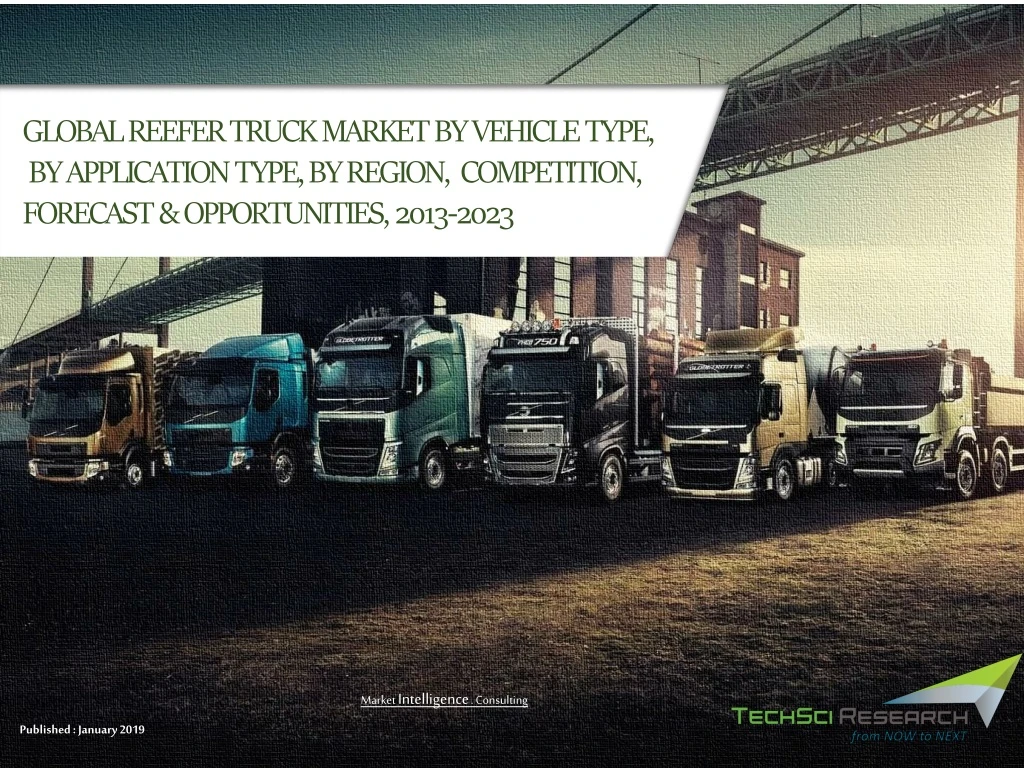
Global reefer truck market stood at around $ 7 billion in 2017 and is forecast to grow at a CAGR of over 9% to reach $ 11.6 billion by 2023. Anticipated growth in the market can be attributed to massive demand for ready-to-eat food items as well as fresh vegetables and dairy products across the globe.

E N D
GLOBAL REEFER TRUCK MARKET BY VEHICLE TYPE, BY APPLICATION TYPE, BY REGION, COMPETITION, FORECAST & OPPORTUNITIES, 2013-2023 Market Intelligence. Consulting Published : January 2019
Ta b l e o f C o n te n t s S. No. Contents 1. Product Overview 2. Research Methodology 3. Analyst View 4. Voice of Customer 4.1. Factors Influencing Purchase Decision 4.2. Brand Recall 4.3. Brand Switching Attributes 4.4. Brand Satisfaction Level 5. Global Reefer Truck Market Outlook 5.1. Market Size & Forecast 5.1.1. By Value & Volume 5.2. Market Share & Forecast 5.2.1. By Vehicle Type (L&MCV, HCV) 5.2.2. By Application Type (Meat & Fish, Dairy Products, Grocery, others) 5.2.3. By Company 5.2.4. By Region (North America, APAC, Europe, MEA, South America) 5.3. Market Attractiveness Index (By Region) 5.4. Market Attractiveness Index (By Vehicle Type) 6. North America Reefer Truck Market Outlook 6.1. Market Size & Forecast 6.1.1. By Value & Volume 2 6.2. Market Share & Forecast © TechSci Research
Ta b l e o f C o n te n t s S. No. Contents 6.2.1. By Vehicle Type (L&MCV, HCV) 6.2.2. By Application Type (Meat & Fish, Dairy Products, Grocery, others) 6.2.3. By Country 6.3. Market Attractiveness Index (By Vehicle Type) 6.4. Market Attractiveness Index (By Country) 6.5. United States Reefer Truck Market Outlook 6.5.1. Market Size & Forecast By Value & Volume 6.5.1.1. 6.5.2. Market Share & Forecast 6.5.2.1. By Vehicle Type (L&MCV, HCV) By Application Type (Meat & Fish, Dairy Products, Grocery, others) 6.5.2.2. 6.5.3. Market Attractiveness Index (By Vehicle Type) 6.6. Canada Reefer Truck Market Outlook 6.6.1. Market Size & Forecast 6.6.1.1. By Value & Volume 6.6.2. Market Share & Forecast 6.6.2.1. By Vehicle Type (L&MCV, HCV) By Application Type (Meat & Fish, Dairy Products, Grocery, others) 6.6.2.2. 6.6.3. Market Attractiveness Index (By Vehicle Type) 3 © TechSci Research
Ta b l e o f C o n te n t s S. No. Contents 6.7. Mexico Reefer Truck Market Outlook Market Size & Forecast 6.7.1. By Value & Volume 6.7.1.1. 6.7.2. Market Share & Forecast 6.7.2.1. By Vehicle Type (L&MCV, HCV) By Application Type (Meat & Fish, Dairy Products, Grocery, others) 6.7.2.2. 6.7.3. Market Attractiveness Index (By Vehicle Type) 7. APAC Reefer Truck Market Outlook 7.1. Market Size & Forecast 7.1.1. By Value & Volume 7.2. Market Share & Forecast 7.2.1. By Vehicle Type (L&MCV, HCV) 7.2.2. By Application Type (Meat & Fish, Dairy Products, Grocery, others) 7.2.3. By Country 7.3. Market Attractiveness Index (By Vehicle Type) Market Attractiveness Index (By Region) 7.4. China Reefer Truck Market Outlook 7.5. 7.5.1. Market Size & Forecast 4 7.5.1.1. By Value & Volume © TechSci Research
Ta b l e o f C o n te n t s S. No. Contents 7.5.2. Market Share & Forecast 7.5.2.1. By Vehicle Type (L&MCV, HCV) By Application Type (Meat & Fish, Dairy Products, Grocery, others) 7.5.2.2. 7.5.3. Market Attractiveness Index (By Vehicle Type) 7.6. Australia Reefer Truck Market Outlook 7.6.1. Market Size & Forecast By Value & Volume 7.6.1.1. 7.6.2. Market Share & Forecast 7.6.2.1. By Vehicle Type (L&MCV, HCV) By Application Type (Meat & Fish, Dairy Products, Grocery, others) 7.6.2.2. 7.6.3. Market Attractiveness Index (By Vehicle Type) 7.7. India Reefer Truck Market Outlook 7.7.1. Market Size & Forecast By Value & Volume 7.7.1.1. 7.7.2. Market Share & Forecast 7.7.2.1. By Vehicle Type (L&MCV, HCV) By Application Type (Meat & Fish, Dairy Products, Grocery, others) 7.7.2.2. 7.7.3. Market Attractiveness Index (By Vehicle Type) 5 © TechSci Research
Ta b l e o f C o n te n t s S. No. Contents 7.8. Japan Reefer Truck Market Outlook 7.8.1. Market Size & Forecast By Value & Volume 7.8.1.1. 7.8.2. Market Share & Forecast 7.8.2.1. By Vehicle Type (L&MCV, HCV) By Application Type (Meat & Fish, Dairy Products, Grocery, others) 7.8.2.2. 7.8.3. Market Attractiveness Index (By Vehicle Type) 8. Europe Reefer Truck Market Outlook 8.1. Market Size & Forecast 8.1.1. By Value & Volume 8.2. Market Share & Forecast 8.2.1. By Vehicle Type (L&MCV, HCV) 8.2.2. By Application Type (Meat & Fish, Dairy Products, Grocery, others) 8.2.3. By Country 8.3. Market Attractiveness Index (By Vehicle Type) Market Attractiveness Index (By Country) 8.4. Germany Reefer Truck Market Outlook 8.5. 8.5.1. Market Size & Forecast 8.5.1.1. By Value & Volume 6 © TechSci Research
Ta b l e o f C o n te n t s S. No. Contents 8.5.2. Market Share & Forecast 8.5.2.1. By Vehicle Type (L&MCV, HCV) By Application Type (Meat & Fish, Dairy Products, Grocery, others) 8.5.2.2. 8.5.3. Market Attractiveness Index (By Vehicle Type) 8.6. United Kingdom Reefer Truck Market Outlook 8.6.1. Market Size & Forecast By Value & Volume 8.6.1.1. 8.6.2. Market Share & Forecast 8.6.2.1. By Vehicle Type (L&MCV, HCV) By Application Type (Meat & Fish, Dairy Products, Grocery, others) 8.6.2.2. 8.6.3. Market Attractiveness Index (By Vehicle Type) 8.7. France Reefer Truck Market Outlook 8.7.1. Market Size & Forecast By Value & Volume 8.7.1.1. 8.7.2. Market Share & Forecast 8.7.2.1. By Vehicle Type (L&MCV, HCV) By Application Type (Meat & Fish, Dairy Products, Grocery, others) 8.7.2.2. 8.7.3. Market Attractiveness Index (By Vehicle Type) 7 © TechSci Research
Ta b l e o f C o n te n t s S. No. Contents 8.8. Spain Reefer Truck Market Outlook 8.8.1. Market Size & Forecast By Value & Volume 8.8.1.1. 8.8.2. Market Share & Forecast 8.8.2.1. By Vehicle Type (L&MCV, HCV) By Application Type (Meat & Fish, Dairy Products, Grocery, others) 8.8.2.2. 8.8.3. Market Attractiveness Index (By Vehicle Type) 8.9. Italy Reefer Truck Market Outlook 8.9.1. Market Size & Forecast By Value & Volume 8.9.1.1. 8.9.2. Market Share & Forecast 8.9.2.1. By Vehicle Type (L&MCV, HCV) By Application Type (Meat & Fish, Dairy Products, Grocery, others) 8.9.2.2. 8.9.3. Market Attractiveness Index (By Vehicle Type) 9. MEA Reefer Truck Market Outlook 9.1. Market Size & Forecast 9.1.1. By Value & Volume 9.2. Market Share & Forecast 8 9.2.1. By Vehicle Type (L&MCV, HCV) © TechSci Research
Ta b l e o f C o n te n t s S. No. Contents 9.2.2. By Application Type (Meat & Fish, Dairy Products, Grocery, others) 9.2.3. By Country 9.3. Market Attractiveness Index (By Vehicle Type) Market Attractiveness Index (By Country) 9.4. 9.5. South Africa Reefer Truck Market Outlook Market Size & Forecast 9.5.1. By Value & Volume 9.5.1.1. 9.5.2. Market Share & Forecast 9.5.2.1. By Vehicle Type (L&MCV, HCV) By Application Type (Meat & Fish, Dairy Products, Grocery, others) 9.5.2.2. 9.5.3. Market Attractiveness Index (By Vehicle Type) 9.6. Saudi Arabia Reefer Truck Market Outlook Market Size & Forecast 9.6.1. By Value & Volume 9.6.1.1. 9.6.2. Market Share & Forecast 9.6.2.1. By Vehicle Type (L&MCV, HCV) By Application Type (Meat & Fish, Dairy Products, Grocery, others) 9.6.2.2. 9 9.6.3. Market Attractiveness Index (By Vehicle Type) © TechSci Research
Ta b l e o f C o n te n t s S. No. Contents 9.7. Iran Reefer Truck Market Outlook 9.7.1. Market Size & Forecast By Value & Volume 9.7.1.1. 9.7.2. Market Share & Forecast 9.7.2.1. By Vehicle Type (L&MCV, HCV) By Application Type (Meat & Fish, Dairy Products, Grocery, others) 9.7.2.2. 9.7.3. Market Attractiveness Index (By Vehicle Type) 9.8. UAE Reefer Truck Market Outlook Market Size & Forecast 9.8.1. By Value & Volume 9.8.1.1. 9.8.2. Market Share & Forecast 9.8.2.1. By Vehicle Type (L&MCV, HCV) By Application Type (Meat & Fish, Dairy Products, Grocery, others) 9.8.2.2. 9.8.3. Market Attractiveness Index (By Vehicle Type) 9.9. Qatar Reefer Truck Market Outlook Market Size & Forecast 9.9.1. By Value & Volume 9.9.1.1. 9.9.2. Market Share & Forecast 9.9.2.1. By Vehicle Type (L&MCV, HCV) By Application Type (Meat & Fish, Dairy Products, Grocery, others) 9.9.2.2. 10 © TechSci Research
Ta b l e o f C o n te n t s S. No. Contents 9.9.3. Market Attractiveness Index (By Vehicle Type) 10. South America Reefer Truck Market Outlook 10.1. Market Size & Forecast 10.1.1. By Value & Volume 10.2. Market Share & Forecast 10.2.1. By Vehicle Type (L&MCV, HCV) 10.2.2. By Application Type (Meat & Fish, Dairy Products, Grocery, others) 10.2.3. By Country 10.3. Market Attractiveness Index (By Vehicle Type) Market Attractiveness Index (By Country) 10.4. 10.5 Brazil Reefer Truck Market Outlook Market Size & Forecast 10.5.1. By Value & Volume 10.5.1.1. 10.5.2. Market Share & Forecast 10.5.2.1. By Vehicle Type (L&MCV, HCV) By Application Type (Meat & Fish, Dairy Products, Grocery, others) 10.5.2.2. 10.5.3. Market Attractiveness Index (By Vehicle Type) 10.6 Argentina Reefer Truck Market Outlook 11 Market Size & Forecast 10.6.1. © TechSci Research
Ta b l e o f C o n te n t s S. No. Contents By Value & Volume 10.6.1.1. 10.6.2. Market Share & Forecast 10.6.2.1. By Vehicle Type (L&MCV, HCV) By Application Type (Meat & Fish, Dairy Products, Grocery, others) 10.6.2.2. 10.6.3. Market Attractiveness Index (By Vehicle Type) 10.7. Colombia Reefer Truck Market Outlook Market Size & Forecast 10.7.1. By Value & Volume 10.7.1.1. 10.7.2. Market Share & Forecast 10.7.2.1. By Vehicle Type (L&MCV, HCV) By Application Type (Meat & Fish, Dairy Products, Grocery, others) 10.7.2.2. 10.7.3. Market Attractiveness Index (By Vehicle Type) 10.8. Chile Reefer Truck Market Outlook Market Size & Forecast 10.8.1. By Value & Volume 10.8.1.1. 10.8.2. Market Share & Forecast 10.8.2.1. By Vehicle Type (L&MCV, HCV) By Application Type (Meat & Fish, Dairy Products, Grocery, others) 10.8.2.2. 10.8.3. Market Attractiveness Index (By Vehicle Type) 12 © TechSci Research
Ta b l e o f C o n te n t s S. No. Contents 11. Market Dynamics 11.1. Drivers 11.2. Challenges 12. Market Trends & Developments 13. Competitive Landscape China International Marine Containers (Group) Co., Ltd. 13.1. Schmitz Cargobull AG 13.2. 13.3. LAMBERET SAS 13.4. Wabash National Corporation 13.5. CHEREAU 13.6. Hyundai Translead 13.7. HKögel Trailer GmbH & Co. KG 13.8. KRONE GMBH & CO. KG 13.9. GRW Tankers and Trailers 13.10. Great Dane LLC 14. Strategic Recommendations 15. About Us & Disclaimer 13 © TechSci Research
L i s t o f F i g u re s S. No. Title Global Reefer Truck Market - Factors Influencing Purchase Decision (N=100) Figure 1: Global Reefer Truck Market - Aided Brand Recall (N=100) Figure 2: Global Reefer Truck Market - Challenges/Unmet needs (N=75) Figure 3: Global Reefer Truck Market - Brand Switching (N=75) Figure 4: Global Reefer Truck Market - Brand Switching Attributes (N=75) Figure 5: Global Reefer Truck Market Brand Satisfaction Level (N=55) Figure 6: Global Reefer Truck Market - Brand Satisfaction Level, By Maintenance (N=55) Figure 7: Global Reefer Truck Market - Brand Satisfaction Level, By Vehicle Handling (N=55) Figure 8: Global Reefer Truck Market - Brand Satisfaction Level, By After-sales service (N=55) Figure 9: Global Reefer Truck Market - Brand Satisfaction Level, By Performance (N=55) Figure 10: Global Reefer Truck Market - Brand Satisfaction Level, By Pricing Factor (N=55) Figure 11: Global Reefer Truck Market - Brand Satisfaction Level, By Load Bearing Capacity (N=55) Figure 12: Global Reefer Truck Market Size, By Value (USD Million), By Volume (Units), 2013-2023F Figure 13: Global Truck Market Size, By Volume (Thousand Units), 2013-2017 Figure 14: Global Reefer Truck Market Share, By Vehicle Type, By Volume, 2013-2023F Figure 15: Global Organic Food Market Size, By Value (USD Million), 2013-2017 Figure 16: Global Reefer Truck Market Share, By Application Type, By Volume, 2013-2023F Figure 17: Global Reefer Truck Market Share, By Company, By Volume, 2017 Figure 18: Global Reefer Truck Market Share, By Region, By Volume, 2013-2023F Figure 19: 14 © TechSci Research
L i s t o f F i g u re s S. No. Title Global Reefer Truck Market Attractiveness Index, By Region, By Volume, 2018E-2023F Figure 20: Global Reefer Truck Market Attractiveness Index, By Vehicle Type, By Volume, 2018E-2023F Figure 21: North America Reefer Truck Market Size, By Value (USD Million), By Volume (Units), 2013- 2023F Figure 22: North America Truck Market Size, By Volume (Thousand Units), 2013-2017 Figure 23: North America Reefer Truck Market Share, By Vehicle Type, By Volume, 2013-2023F Figure 24: North America Reefer Truck Market Share, By Application Type, By Volume, 2013-2023F Figure 25: North America Reefer Truck Market Share, By Country, By Volume, 2013-2023F Figure 26: North America Reefer Truck Market Attractiveness Index, By Vehicle Type, By Volume, 2018E-2023F Figure 27: North America Reefer Truck Market Attractiveness Index, By Country, By Volume, 2018E-2023F Figure 28: United States Reefer Truck Market Size, By Value (USD Million), By Volume (Units), 2013- 2023F Figure 29: United States Refrigerated Warehouse Capacity (M/m3), 2014, 2016 & 2018 Figure 30: United States Organic Food Market Size, By Value (USD Million), 2013-2017 Figure 31: United States Reefer Truck Market Share, By Vehicle Type, By Volume, 2013-2023F Figure 32: United States Year-on-Year Change (%) for Vegetable Sales, 2015-2018 Figure 33: United States Reefer Truck Market Share, By Application Type, By Volume, 2013-2023F Figure 34: United States Organic Food Market Share, By Value, 2017 Figure 35: United States Reefer Truck Market Attractiveness Index, By Vehicle Type, By Volume, 2018E- 2023F Figure 36: Canada Reefer Truck Market Size, By Value (USD Million), By Volume (Units), 2013-2023F Figure 37: Canada Refrigerated Warehouse Capacity (M/m3), 2014, 2016 & 2018 Figure 38: 15 © TechSci Research
L i s t o f F i g u re s S. No. Title Canada Organic Food Market Size, By Value (USD Million), 2013-2017 Figure 39: Canada Reefer Truck Market Share, By Vehicle Type, By Volume, 2013-2023F Figure 40: Canada Reefer Truck Market Share, By Application Type, By Volume, 2013-2023F Figure 41: Canada Organic Food Market Share, By Value, 2017 Figure 42: Canada Reefer Truck Market Attractiveness Index, By Vehicle Type, By Volume, 2018E-2023F Figure 43: Mexico Reefer Truck Market Size, By Value (USD Million), By Volume (Units), 2013-2023F Figure 44: Mexico Refrigerated Warehouse Capacity (M/m3), 2014, 2016 & 2018 Figure 45: Mexico Organic Food Market Size, By Value (USD Million), 2013-2017 Figure 46: Mexico Reefer Truck Market Share, By Vehicle Type, By Volume, 2013-2023F Figure 47: Mexico Reefer Truck Market Share, By Application Type, By Volume, 2013-2023F Figure 48: Mexico Organic Food Market Share, By Value, 2017 Figure 49: Mexico Reefer Truck Market Attractiveness Index, By Vehicle Type, By Volume, 2018E-2023F Figure 50: APAC Reefer Truck Market Size, By Value (USD Million), By Volume (Units), 2013-2023F Figure 51: APAC Organic Food Market Size, By Value (USD Million), 2013-2017 Figure 52: APAC Truck Market Size, By Volume (Units), 2013-2017 Figure 53: APAC Reefer Truck Market Share, By Vehicle Type, By Volume, 2013-2023F Figure 54: APAC Reefer Truck Market Share, By Application Type, By Volume, 2013-2023F Figure 55: APAC Organic Food Market Share, By Product Type, By Value, 2017 Figure 56: APAC Reefer Truck Market Share, By Country, By Volume, 2013-2023F Figure 57: 16 © TechSci Research
L i s t o f F i g u re s S. No. Title APAC Organic Food Market Share, By Country, By Value 2017 Figure 58: APAC Reefer Truck Market Attractiveness Index, By Vehicle Type, By Volume, 2018E-2023F Figure 59: APAC Reefer Truck Market Attractiveness Index, By Country, By Volume, 2018E-2023F Figure 60: China Reefer Truck Market Size, By Value (USD Million), By Volume, 2013-2023F Figure 61: China Refrigerated Warehouse Capacity (M/m3), 2014, 2016 & 2018 Figure 62: China Organic Food Market Size, By Value(USD Million), 2013-2017 Figure 63: China Reefer Truck Market Share, By Vehicle Type, By Volume, 2013-2023F Figure 64: China Reefer Truck Market Share, By Application Type, By Volume, 2013-2023F Figure 65: China Organic Food Market Share, By Value, 2017 Figure 66: China Reefer Truck Market Attractiveness Index, By Vehicle Type, By Volume, 2018E-2023F Figure 67: Australia Reefer Truck Market Size, By Value (USD Million), By Volume (Units), 2013-2023F Figure 68: Australia Refrigerated Warehouse Capacity (M/m3), 2014, 2016 & 2018 Figure 69: Australia Organic Food Market Size, By Value (USD Million), 2013-2017 Figure 70: Australia Reefer Truck Market Share, By Vehicle Type, By Volume, 2013-2023F Figure 71: Australia Reefer Truck Market Share, By Application Type, By Volume, 2013-2023F Figure 72: Australia Organic Food Market Share, By Value, 2017 Figure 73: Australia Reefer Truck Market Attractiveness Index, By Vehicle Type, By Volume, 2018E-2023F Figure 74: India Reefer Truck Market Size, By Value (USD Million), By Volume (Units), 2013-2023F Figure 75: India Refrigerated Warehouse Capacity (M/m3), 2014, 2016 & 2018 Figure 76: 17 © TechSci Research
L i s t o f F i g u re s S. No. Title India Organic Food Market Size, By Value (USD Million), 2013-2027 Figure 77: India Reefer Truck Market Share, By Vehicle Type, By Volume, 2013-2023F Figure 78: India Reefer Truck Market Share, By Application Type, By Volume, 2013-2023F Figure 79: India Organic Food Market Share, By Value, 2017 Figure 80: India Reefer Truck Market Attractiveness Index, By Vehicle Type, By Volume, 2018E-2023F Figure 81: Japan Reefer Truck Market Size, By Value (USD Million), By Volume (Units), 2013-2023F Figure 82: Japan Refrigerated Warehouse Capacity (M/m3), 2014, 2016 & 2018 Figure 83: Japan Organic Food Market Size, By Value (USD Million), 2013-2017 Figure 84: Japan Reefer Truck Market Share, By Vehicle Type, By Volume, 2013-2023F Figure 85: Japan Reefer Truck Market Share, By Application Type, By Volume, 2013-2023F Figure 86: Japan Reefer Truck Market Attractiveness Index, By Vehicle Type, By Volume, 2018E-2023F Figure 87: Europe Reefer Truck Market Size, By Value (USD Million), By Volume (Units), 2013-2023F Figure 88: Europe Truck Market Size, By Volume (Thousand Units), 2013-2017E Figure 89: Europe Reefer Truck Market Share, By Vehicle Type, By Volume, 2013-2023F Figure 90: Europe Reefer Truck Market Share, By Application Type, By Volume, 2013-2023F Figure 91: Europe Reefer Truck Market Share, By Country, By Volume, 2013-2023F Figure 92: Europe Reefer Truck Market Attractiveness Index, By Vehicle Type, By Volume, 2018E-2023F Figure 93: Europe Reefer Truck Market Attractiveness Index, By Country, By Volume, 2018E-2023F Figure 94: Germany Reefer Truck Market Size, By Value (USD Million), By Volume (Units), 2013-2023F Figure 95: 18 © TechSci Research
L i s t o f F i g u re s S. No. Title Germany Refrigerated Warehouse Capacity (M/m3), 2014 & 2016 Figure 96: Germany Organic Food Market Size, By Value (USD Million), 2013-2017 Figure 97: Germany Reefer Truck Market Share, By Vehicle Type, By Volume, 2013-2023F Figure 98: Germany Reefer Truck Market Share, By Application Type, By Volume, 2013-2023F Figure 99: Germany Organic Food Market Share, By Value, 2017 Figure 100: Germany Reefer Truck Market Attractiveness Index, By Vehicle Type, By Volume, 2018E-2023F Figure 101: United Kingdom Reefer Truck Market Size, By Value (USD Million), By Volume (Units), 2013- 2023F Figure 102: United Kingdom Refrigerated Warehouse Capacity (M/m3), 2014, 2016 & 2018 Figure 103: United Kingdom Organic Food Market Size, By Value (USD Million), 2013-2017 Figure 104: United Kingdom Reefer Truck Market Share, By Vehicle Type, By Volume, 2013-2023F Figure 105: United Kingdom Reefer Truck Market Share, By Application Type, By Volume, 2013-2023F Figure 106: United Kingdom Organic Food Market Share, By Value, 2017 Figure 107: United Kingdom Reefer Truck Market Attractiveness Index, By Vehicle Type, By Volume, 2018E-2023F Figure 108: France Reefer Truck Market Size, By Value (USD Million), By Volume (Units), 2013-2023F Figure 109: France Refrigerated Warehouse Capacity (M/m3), 2014 & 2016 Figure 110: France Organic Food Market Size, By Value(USD Million), 2013-2017 Figure 111: France Reefer Truck Market Share, By Vehicle Type, By Volume, 2013-2023F Figure 112: France Reefer Truck Market Share, By Application Type, By Volume, 2013-2023F Figure 113: France Organic Food Market Share, By Value, 2017 Figure 114: 19 © TechSci Research
L i s t o f F i g u re s S. No. Title France Reefer Truck Market Attractiveness Index, By Vehicle Type, By Volume, 2018E-2023F Figure 115: Spain Reefer Truck Market Size, By Value (USD Million), By Volume (Units), 2013-2023F Figure 116: Spain Truck Market Size, By Volume (Thousand Units), 2013-2017 Figure 117: Spain Reefer Truck Market Share, By Vehicle Type, By Volume, 2013-2023F Figure 118: Spain Reefer Truck Market Share, By Application Type, By Volume, 2013-2023F Figure 119: Spain Reefer Truck Market Attractiveness Index, By Vehicle Type, By Volume, 2018E-2023F Figure 120: Italy Reefer Truck Market Size, By Value (USD Million), By Volume (Units), 2013-2023F Figure 121: Italy Refrigerated Warehouse Capacity (M/m3), 2014 & 2016 Figure 122: Italy Organic Food Market Size, By Value (USD Million), 2013-2014 Figure 123: Italy Reefer Truck Market Share, By Vehicle Type, By Volume, 2013-2023F Figure 124: Italy Reefer Truck Market Share, By Application Type, By Volume, 2013-2023F Figure 125: Italy Organic Food Market Share, By Value, 2017 Figure 126: Italy Reefer Truck Market Attractiveness Index, By Vehicle Type, By Volume, 2018E-2023F Figure 127: MEA Reefer Truck Market Size, By Value (USD Million), By Volume (Units), 2013-2023F Figure 128: MEA Truck Market Size, By Volume (Units), 2013-2017 Figure 129: MEA Reefer Truck Market Share, By Vehicle Type, By Volume, 2013-2023F Figure 130: MEA Reefer Truck Market Share, By Application Type, By Volume, 2013-2023F Figure 131: MEA Reefer Truck Market Share, By Country, By Volume, 2013-2023F Figure 132: MEA Reefer Truck Market Attractiveness Index, By Vehicle Type, By Volume, 2018E-2023F Figure 133: 20 © TechSci Research
L i s t o f F i g u re s S. No. Title MEA Reefer Truck Market Attractiveness Index, By Country, By Volume, 2018E-2023F Figure 134: South Africa Reefer Truck Market Size, By Value (USD Million), By Volume (Units), 2013-2023F Figure 135: South Africa Refrigerated Warehouse Capacity (M/m3), 2014 & 2016 Figure 136: South Africa Organic Food Market Size, By Value (USD Million), 2013-2017 Figure 137: South Africa Reefer Truck Market Share, By Vehicle Type, By Volume, 2013-2023F Figure 138: South Africa Reefer Truck Market Share, By Application Type, By Volume, 2013-2023F Figure 139: South Africa Organic Food Market Share, By Value, 2017 Figure 140: South Africa Reefer Truck Market Attractiveness Index, By Vehicle Type, By Volume, 2018E- 2023F Figure 141: Saudi Arabia Reefer Truck Market Size, By Value (USD Million), By Volume (Units), 2013-2023F Figure 142: Saudi Arabia Organic Food Market Size , By Value (USD Million), 2013-2017 Figure 143: Saudi Arabia Reefer Truck Market Share, By Vehicle Type, By Volume, 2013-2023F Figure 144: Saudi Arabia Reefer Truck Market Share, By Application Type, By Volume, 2013-2023F Figure 145: Saudi Arabia Organic Food Market Share, BY Value, 2017 Figure 146: Saudi Arabia Reefer Truck Market Attractiveness Index, By Vehicle Type, By Volume, 2018E- 2023F Figure 147: Iran Reefer Truck Market Size, By Value (USD Million), By Volume (Units), 2013-2023F Figure 148: Iran Agricultural Food Product Import and Export Statistics, By Value (USD Million), 2013-2016 Figure 149: Iran Reefer Truck Market Share, By Vehicle Type, By Volume, 2013-2023F Figure 150: Iran Reefer Truck Market Share, By Application Type, By Volume, 2013-2023F Figure 151: Iran Reefer Truck Market Attractiveness Index, By Vehicle Type, By Volume, 2018E-2023F Figure 152: 21 © TechSci Research
L i s t o f F i g u re s S. No. Title UAE Reefer Truck Market Size, By Value (USD Million), By Volume (Units), 2013-2023F Figure 153: UAE Organic Food Market Size, By Value (USD Million), 2013-2017 Figure 154: UAE Reefer Truck Market Share, By Vehicle Type, By Volume, 2013-2023F Figure 155: UAE Reefer Truck Market Share, By Application Type, By Volume, 2013-2023F Figure 156: UAE Organic Food Market Share, By Value, 2017 Figure 157: UAE Reefer Truck Market Attractiveness Index, By Vehicle Type, By Volume, 2013-2023F Figure 158: Qatar Reefer Truck Market Size, By Value (USD Million), By Volume (Units), 2013-2023F Figure 159: Major Countries Importing Food in Qatar, 2017 Figure 160: Qatar Reefer Truck Market Share, By Vehicle Type, By Volume, 2013-2023F Figure 161: Qatar Truck Market Size, By Volume (Thousand Units), 2013-2017 Figure 162: Qatar Reefer Truck Market Share, By Application Type, By Volume, 2013-2023F Figure 163: Qatar Reefer Truck Market Attractiveness Index, By Vehicle Type, By Volume, 2013-2023F Figure 164: South America Reefer Truck Market Size, By Value (USD Million), By Volume (Units), 2013- 2023F Figure 165: South America Truck Market Size, By Volume (Thousand Units), 2013-2017 Figure 166: South America Reefer Truck Market Share, By Vehicle Type, By Volume, 2013-2023F Figure 167: South America Reefer Truck Market Share, By Application Type, By Volume, 2013-2023F Figure 168: South America Reefer Truck Market Share, By Country, By Volume, 2013-2023F Figure 169: South America Reefer Truck Market Attractiveness Index, By Vehicle Type, By Volume, 2018E-2023F Figure 170: South America Reefer Truck Market Attractiveness Index, By Country, By Volume, 2018E- 2023F Figure 171: 22 © TechSci Research
L i s t o f F i g u re s S. No. Title Brazil Reefer Truck Market Size, By Value (USD Million), By Volume (Units), 2013-2023F Figure 172: Brazil Refrigerated Warehouse Capacity (M/m3), 2014, 2016 & 2018 Figure 173: Brazil Organic Food Market Size, By Value (USD Million), 2013-2017 Figure 174: Brazil Reefer Truck Market Share, By Vehicle Type, By Volume, 2013-2023F Figure 175: Brazil Reefer Truck Market Share, By Application Type, By Volume, 2013-2023F Figure 176: Brazil Organic Food Market Share, By Value, 2017 Figure 177: Brazil Reefer Truck Market Attractiveness Index, By Vehicle Type, By Volume, 2018E-2023F Figure 178: Argentina Reefer Truck Market Size, By Value (USD Million), By Volume (Units), 2013-2023F Figure 179: Argentina Organic Food Market Size, By Value (USD Million), 2013-2017 Figure 180: Argentina Reefer Truck Market Share, By Vehicle Type, By Volume, 2013-2023F Figure 181: Argentina Reefer Truck Market Share, By Application Type, By Volume, 2013-2023F Figure 182: Argentina Organic Food Market Share, By Value, 2017 Figure 183: Argentina Reefer Truck Market Attractiveness Index, By Vehicle Type, By Volume, 2018E- 2023F Figure 184: Colombia Reefer Truck Market Size, By Value (USD Million), By Volume (Units), 2013-2023F Figure 185: Colombia Organic Food Market Size, By Value (USD Million), 2013-2017 Figure 186: Colombia Reefer Truck Market Share, By Vehicle Type, By Volume, 2013-2023F Figure 187: Colombia Reefer Truck Market Share, By Application Type, By Volume, 2013-2023F Figure 188: Colombia Organic Food Market Share, By Value, 2017 Figure 189: Colombia Reefer Truck Market Attractiveness Index, By Vehicle Type, By Volume, 2018E- 2023F Figure 190: 23 © TechSci Research
L i s t o f F i g u re s S. No. Title Chile Reefer Truck Market Size, By Value (USD Million), By Volume (Units), 2013-2023F Figure 191: Chile Refrigerated Warehouse Capacity (M/m3), 2014, 2016 & 2018 Figure 192: Chile Reefer Truck Market Share, By Vehicle Type, By Volume, 2013-2023F Figure 193: Chile Reefer Truck Market Share, By Application Type, By Volume, 2013-2023F Figure 194: Chile Import Statistics of Consumer Oriented Products, By Value (USD Million), 2015-2017 Figure 195: Chile Reefer Truck Market Attractiveness Index, By Vehicle Type, By Volume, 2018E-2023F Figure 196: L i s t o f Ta b l e s S. No. Title China Reefer Truck Manufacturers and Third-Party Logistics Company Table 1: Iran Import Duties on Food Products, 2016 Table 2: 24 © TechSci Research
P ro d u c t O ve r v i e w Product Definition “A reefer truck is a refrigerated trailer attached to a semi-truck in order to transport perishable and other temperature-sensitive goods. Temperature control operation for these kind of trucks are being managed by different methods which includes diesel powered generators and Cryogenic Cooling. The L&MCV reefer truck majorly comes between 3.5 -16 tons and HCV reefer truck comes up to 30 tons capacity. Usually, length of reefer trucks vary between 28 and 53 feet, and do not exceed 13.5 feet in height.” Product Classification Segment Tonnage Capacity (Tons) Application Meat & Fish • Grocery • L&MCV (3.5-16 tons) • Reefer Truck Dairy Product • HCV (16-Above 30 tons) • Others • 25 © TechSci Research
Re s e a rc h M e t h o d o l o g y Market Profiling •In-depth secondary research was conducted to determine top players in the Global Reefer Truck market, overall market market size. size and segmental Research & Intelligence Data Collection Data Filter & Analysis Actionable Insights Business Solution Formulating Questionnaire Identifying Key Opinion Leaders Questionnaire Design In-depth Interviews •In order to conduct interviews with industry experts, TechSci Research formulated a detailed questionnaire. Recent Developments Market Changing Aspects/Dynam ics Government Policies Final Conclusion Developing List of Respondents A Primary Research •List industry specialists was developed. of industry players, distributors, and B Desk Research Data Collection C Company Analysis •TechSci industry collection and verification. Research experts, conducted industry interviews players, with data Market Participants Key Strengths Commercial Vehicle Portfolio for Data Validation •Data secondary rigorous triangulation. obtained as a result was of primary and Primary Research Secondary Research Paid Sources research validated through LinkedIn TechSci Internal database Company Website Company Annual Reports White Paper Study Financial Reports Investor Presentations Regulatory Body, Associations, etc. Factiva Hoovers Data Analysis •The data was scrutinized using MS-Excel and statistical tools such as Time Series Analysis, etc., to obtain qualitative insights about the Global Reefer Truck market. and quantitative 26 © TechSci Research
Re s e a rc h M e t h o d o l o g y Baseline Methodology: For the study, TechSci Research has gathered information through primary research surveys with leading truck companies operating globally. We have also put through an exhaustive search of credible paid databases such as Business Week, Factiva, Hoovers, etc., including our internal database. Our team of analysts has then prudently evaluated all the collected information and presented the same in chronological order to depict a meaningful and clear picture of Global Reefer Truck market. While compiling the data, we have also cross-checked all the collected information from multiple sources and data warehouses, so as to present the most accurate and precise information of the concerned industry. Sampling Technique: While conducting the study, TechSci Research followed the stratified random sampling technique to shortlist the Key Opinion Leaders (KOLs) in various reefer truck companies/dealers, associations & distributors operating globally. KOLs based out of prominent reefer truck companies/dealers & distributors were interviewed to identify the size of Global Reefer Truck market. Sample Size: KOLs No. of Respondents Mid to Senior Management, Sales Managers, etc., of truck Companies/ Associations, Dealers & Distributors Industry Experts Total 80 20 100 27 © TechSci Research
Re s e a rc h M e t h o d o l o g y Market Size Calculation Technique: Primary Research For the preparation of ‘Global Reefer Truck Market’ report, bottom-up model has been used, which has been later cross validated by using top-down approach. TechSci Research interviewed Senior Managers and Regional Sales Managers of the prominent reefer truck manufacturing companies/dealers & distributors using Delphi technique for calculating the size of Global Reefer Truck market. Respondents were also asked about the current and future growth rates, market share by Vehicle Types, etc. All the information gathered was carefully analyzed. Data points which exhibited high deviations from the majority estimates were eliminated as outliers and the remaining refined data points were put together to arrive at the volume data. Primary Research – Few of the Companies and/or their Dealers Interviewed S. No. Partial List of Companies and/or their Dealers Interviewed Company 1. Wabash National Corporation 2. Schmitz Cargobull AG 3 China International Marine Containers (Group) Co., Ltd. 4. LAMBERET SAS 5. CHEREAU 6. Kögel Trailer GmbH & Co. KG 7. KRONE GMBH & CO. KG 8. GRW Tankers and Trailers 9. SOR IBERICA, SA 28 10. Great Dane Llc © TechSci Research
Re s e a rc h M e t h o d o l o g y Secondary Research: We have also put through an exhaustive search of credible paid databases such as Factiva, Hoovers, etc., in addition to our internal database. Further analysis of credible publications, white papers, company’s annual reports, investor presentations, news articles, etc., were also analyzed to cross validate the end findings derived from primary research. S. No. Few of the Secondary Sources 1. Organisation Internationale des Constructeurs d’Automobiles (OICA) 2. German Association of the Automotive Industry(VDA) 3 Australian Food Cold Chain Council(AFCCC) 4. National Association of Motor Vehicle Manufacturers(ANFAVEA) 5. Italian Union of Automobile Manufacturers(ANFIA) 6. Global Cold Chain Alliance(GCCA) 7. European Automobile Manufacturers’ Association(ACEA) 8. International Council On Clean Transportation(ICCT) 9. Southern African Refrigerated Distribution Association (SARDA) 10. Japan Automobile Manufacturers Association, Inc.(JAMA) Forecasting Technique: The forecast is based on econometric and judgemental analysis in addition to statistical techniques such as averaging and geometric mean. During primary research interview, questions regarding historical sales trend of reefer truck market were put forward. Respondents were asked about the current and future growth rates, market share by truck type across the globe. In order to forecast truck market, following forecast techniques were used: • Time Series Analysis • Econometric and Judgmental Analysis • Moving Average 29 © TechSci Research
I n d u s t r y B r i e f Reefer Truck Market to Grow at 9% until 2023: TechSci Research According to TechSci Research report, “Global Reefer Truck Market By Vehicle Type, By Application Type, By Region, Competition, Forecast & Opportunities, 2013 - 2023”, the global reefer truck market is projected to grow at a CAGR of more than 9% on account of surging demand for fresh food as people are becoming more health conscious and growing restaurants and retail store businesses across the globe. Moreover, consumers across the globe are getting more concerned about food safety and standards, which is positively influencing global reefer trucks market. Additionally, increasing research and development on food transport, backed by various joint ventures and investments by leading companies in fresh fruits, vegetables and meat items is further anticipated to compliment the global reefer truck market during the forecast period.. In 2017, L&MCV reefer truck dominated the global reefer truck market with over two-third of the volume share. A large demand for reefer trucks emanates from North America owing to massive growth of e-commerce for last mile delivery and comparatively higher health awareness in the region. However, Asia-Pacific is anticipated to witness the fastest growth in the market due to rising per capita income and growing consumption. Some of the major players operating in the global reefer truck market include Schmitz Cargobull AG, Wabash National Corporation, CHEREAU, Kögel, and CIMC, among others. These players are expanding their presence and working on more technologically advanced and affordable reefer trucks to expand their market share. Furthermore, increasing investments and continuous product development by automotive companies in the temperature control unit is also anticipated to compliment the global reefer truck market. “Demand for reefer trucks is growing owing to rising demand from restaurants and supermarkets across the globe, coupled with rising demand for unique food items, such as Solomon fish, Australian buffalo milk, etc. Moreover, stringent government regulations across various countries on food supply and distribution to ensure food safety with respect to freshness and quality is further driving demand for reefer trucks, globally. Additionally, many ongoing research and development projects such as use of solar panel in refer trucks, telematics service, etc., would further steer the global reefer truck market during forecast period.” said Mr. Karan Chechi, Research Director with TechSci Research, a research based global management consulting firm. 30 30 © TechSci Research © TechSci Research
S a m p l e D a t a - S n a p s h o t Figure 28: North America Reefer Truck Market Figure 31: United States Organic Food Market Size, Attractiveness Index, By Country, By Volume, 2018E-2023F By Value (USD Million), 2013-2017 8.00% Mexico CAGR (2018E-2022F) 6.00% Canada United States 4.00% 2.00% 2013 2014 2015 2016 2017 0.00% 0.00 0.50 1.00 1.50 2.00 Figure 114: France Organic Food Figure 49: Mexico Organic Food Market Market Share, By Value, 2017 Share, By Value, 2017 Low Medium High 50.00% 50.00% 50.00% 50.00% Figure 1: Global Reefer Truck Market - 50.00% 50.00% 50.00% 50.00% Factors Influencing Purchase Decision (N=xx) 50.00% 50.00% 50.00% 50.00% Price Cooling & load bearing capacity Figure 40: Canada Reefer Truck Market Share, By Vehicle Type, By Volume, 2013-2023F Performance 30.00% 30.00% 30.00% 30.00% 30.00% 30.00% 30.00% 30.00% 30.00% 30.00% 30.00% After sales Service 10.00% 10.00% 10.00% 10.00% 10.00% 10.00% 10.00% 10.00% 10.00% 10.00% 10.00% 2013 2014 2015 2016 2017 2018E 2019F 2020F 2021F 2022F 2023F Brand 31 L&MCV HCV © TechSci Research
Re p o r t O rd e r i n g Report Name: GLOBAL REEFER TRUCK MARKET BY VEHICLE TYPE, BY APPLICATION TYPE, BY REGION, COMPETITION, FORECAST & OPPORTUNITIES, 2013-2023 Report Price License Type Price Single- User License $4450 Multi- User License $5450 Custom User License $9450 To View Sample OR Purchase Report 32 32 © TechSci Research © TechSci Research
A b o u t U s & D i s c l a i m e r About Us TechSci Research is a global market research and consulting company with offices in the US, UK and India. TechSci Research provides market research reports in a number of areas to organizations. The company uses innovative business models that focus on improving productivity, while ensuring creation of high-quality reports. The proprietary forecasting models use various analyses of both industry- specific and macroeconomic variables on a state-by-state basis to produce a unique ‘bottom-up’ model of a country, regional and global industry prospects. Combined with the detailed analysis of company activity and industry trends, the result is a uniquely rich evaluation of the opportunities available in the market. Related Reports Global Drone Market Forecast & Opportunities, 2023 Global Rock Breaker Market Forecast & Opportunities, 2023 Global Tractor Market Forecast & Opportunities, 2023 Partial List of Clients Disclaimer The contents of this report are based on information generally available to the public from sources believed to be reliable. No representation is made that it is timely, accurate or complete. TechSci Research has taken due care and caution in compilation of data as this has been obtained from various sources including which it considers reliable and first hand. However, TechSci Research does not guarantee the accuracy, adequacy or completeness of any information and it is not responsible for any errors or omissions or for the results obtained from the use of such information and especially states that it has no financial liability whatsoever to the subscribers / users of this report. The information herein, together with all estimates and forecasts, can change without notice. All the figures provided in this document are indicative of relative market size and are strictly for client’s internal consumption. Usage of the same for purpose other than internal will require prior approval of TechSci Research. TechSci Research – North America 708 Third Avenue, Manhattan, New York, United States Tel: +1- 646- 360- 1656 Email: sales@techsciresearch.com www.techsciresearch.com TechSci Research – Europe 54, Oldbrook, Bretton, Peterborough, United Kingdom Email: sales@techsciresearch.com www.techsciresearch.com TechSci Research – Africa B – 44, Sector -57, Noida, National Capital Region, U.P. - India Tel: +91-120-4523900 Email: sales@techsciresearch.com www.techsciresearch.com 33 © TechSci Research