Download

1 / 9
90 likes | 90 Views
Rooney Real Estateu2019s overall first-month conclusions are that South Bostonu2019s residential real estate has shown considerably more energy during January 2020 u2013 a trend that we feel began right after Christmas.

E N D
South Boston Market Recap January 2020 By: Rooney Real Estate
We are only one month into calendar 2020, so it is somewhat too early to establish year-long trends reliably. However, Rooney Real Estate’s overall first-month conclusions are that South Boston’s residential real estate has shown considerably more energy during January 2020 – a trend that we feel began right after Christmas. There are certain quantitative reasons we are saying this: the weather has been measurably warmer than usual and despite many predictions to the contrary, interest rates have dropped significantly since last fall – from a high of about 4.65% back then, to recent individual agreements as low as 3.45%. A drop of over 1% is quite significant over the life of a mortgage. And Consumer Confidence rose to 101.3 – the highest it has been since 2014. Qualitatively, since year-end greater numbers of viewers have been showing up at our open houses in South Boston – perhaps two or three times as many as those who came before Christmas, and during the fall months of 2019. And as odd as this may sound, when the Patriots aren’t on their way to the Super Bowl, more potential buyers spend their January weekends looking at real estate.
The following are our specific comments, as of January 31 this year: Under “Listing Inventory”, the number of Listing Units stayed essentially the same, but Median Days on the Market dropped sharply – 98 in January 2019, to 51 this January (-48%). Median days on the market for Listing Inventory (units that were on the market as of January 31st, 2020) dropped significantly to 51 days from 116 days in Dec 2019. This indicates that some absorption of older inventory along with the addition of newer inventory (74 units). Under Agreement (listing units that went pending) rose from 37 last January to 51 this January (+38%) and considerably higher than the 15 sale pending units in December of 2019.
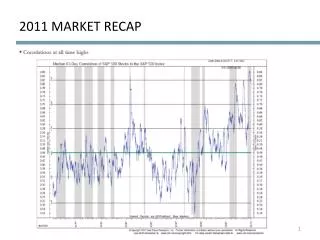
The following are our specific comments, as of January 31 this year: Inventory at 1.9 months this January, about a third of what it should be, is still very low. Even with all the current building taking place in South Boston, the 1.9 inventory means that homes are not being put on the market and perhaps are being rented instead. But currently approved rental unit projects will add more than 500 units to South Boston stock. What will this mean as 2020 progresses? Below is a chart comparing the overall statistics from Jan 19' to Jan 20'. One thing to keep in mind is the fact month to month is not the greatest comparison of market trends due to the possibility of a high-end / large development closing in a particular month can skew the statistics.
The Chart below contains all Single and Mulit-family properties that closed in January 2020 Singles Address Price Date Sqft Lot Size Bed(s) Bath(s) Parking 504 E 3rdSt $1,125,000 1/23/20 1,088 1,216 2 1 None 776 E 6thSt $845,000 1/23/20 1,562 1,149 3 1 None Two-family's Address Price Date Sqft Lot Size Bed(s) Bath(s) Parking 16 Beckler Ave $800,000 1/24/20 1,713 1,029 4 2.5 None
The Chart below contains all Single and Mulit-family properties that closed in January 2020 Three-family's Address Price Date Sqft Lot Size Bed(s) Bath(s) Parking 5 Douglass St $1,740,000 1/31/20 2,418 1,306 6 3 None 11 Carpenter St $1,050,000 1/31/20 2,208 1,730 6 3 None 174 W 7thSt $925,000 1/9/20 2,202 1,187 7 3 None
The Chart below contains all Condominiums that closed in January 2020. Address Price Date Sold Sqft Bed(s) Bath(s) Parking Year Built /Converted 14 W Broadway #906 $1,675,000 1/15/20 1,735 2 3 1 Garage 2017 14 W Broadway #907 509 E 1stSt #7 660 W 7thSt #2 346-354 Congress St #613 287 Old Colony Ave #5 82 G St #1 545 E 3rdSt #6 509 E 2ndSt #1 141 W 2ndSt #206 537 E 1stSt #4 225 Dorchester St #14 9 W Broadway #107 901 E Broadway #1 170 W Broadway #308 287 Old Colony Ave #3 287 Old Colony Ave #1 527 E Broadway #203 $1,550,000 $1,250,000 $1,120,000 $1,184,000 $1,180,000 $1,077,00 $1,100,0000 $1,100,000 $1,065,000 $1,045,000 $1,025,000 $923,000 $890,000 $865,000 $829,000 $799,000 $795,000 1/3/20 1/31/20 1/30/20 1/16/20 1/24/20 1/21/20 1/8/20 1/27/20 1/14/20 1/17/20 1/10/20 1/22/20 1/14/20 1/6/20 1/23/20 1/17/20 1/24/20 1,653 1,600 1,668 1,159 2,000 1,978 1,600 1,685 1,302 1,358 2,011 1,498 1,410 1,045 1,207 1,226 1,153 2 2 3 2 3 3 3 2 2 2 2 2 2 2 2 2 2 2.5 2 3 2 2.5 2.5 3 2 2 2 2 2 2 2 2 2 2 1 Garage 1 Garage None 1 Garage 1 Garage 1 off-street 1 Garage 2 Garage 1 Garage 1 Garage 2 Garage 1 Garage 2 Garage 1 Garage 1 Garage 1 Garage 1 Garage 2017 2018 2019 2008 2019 2015 2019 2012 2010 2013 2016 2004 2015 2017 2019 2019 2019
The Chart below contains all Condominiums that closed in January 2020. 772 E 6thSt #2 9 W Broadway #206 204 N St #2 5 Mohawk St #3 774 E 7thSt #2 287 Old Colony Ave #2 180 Gold St #5 29 Vinton St #6 146 M St #1 315 W 3rdSt #2 486 E 3rdSt #12 $789,000 $775,000 $729,000 $700,000 $690,000 $679,000 $665,000 $665,000 $660,000 $628,000 $559,000 1/16/20 1/31/20 1/28/20 1/31/20 1/3/20 1/21/20 1/21/20 1/30/20 1/16/20 1/31/20 1/29/20 1,035 1,129 1,002 1,034 974 849 819 1,209 796 965 902 2 1 2 2 2 2 2 2 2 2 2 1 2 2 2 2 2 1 2 2 1 1 None 1 Garage None None None 1 Garage 1 Tandem 1 off-street None None 1 off-street 2 Garage (tandem) None None 1 off-street None Common None 2019 2004 2008 2015 2019 2013 2004 2019 2011 1993 2005 34 Mitchell St #2 $577,500 1/21/20 708 2 1 772 E 6thSt #1 175 W 7thSt #2 350 W 4thSt #410 271 K St #3 17 Lennon Ct #17 21 Wormwood St #306 $575,000 $575,000 $560,00 $486,000 $438,000 $329,000 1/6/20 1/3/20 1/17/20 1/23/20 1/10/20 1/6/20 883 754 753 1,288 780 630 1 2 2 3 2 1 1 1 1 2 1 1 2019 2017 1987 2000 1978 1999
Contact Us For More Detail: Contact Person: Jackie Rooney Phone: 617-203-6462 Email: jackie@rooney-re.com Website: https://www.rooney-re.com Follow Us: Facebook: https://www.facebook.com/RooneyRealEstate/ Twitter: https://twitter.com/RooneyRe Instagram: https://www.instagram.com/rooneyre/ Linkedin: https://www.linkedin.com/company/rooney- real-estate-inc Pinterest: https://in.pinterest.com/rooneyre700