Download
1 / 22
240 likes | 490 Views
In the latest report, you will find that farming, food processing and dairy currently represent the three largest segments in the entire agriculture market. Floriculture, sericulture and cold chains, on the other hand, represented the three fastest growing segments. This report serves excellent guide for all who are planning to foray into the Indian agriculture market in any form. Link to report: http://www.imarcgroup.com/agriculture-industry-in-india<br>

E N D
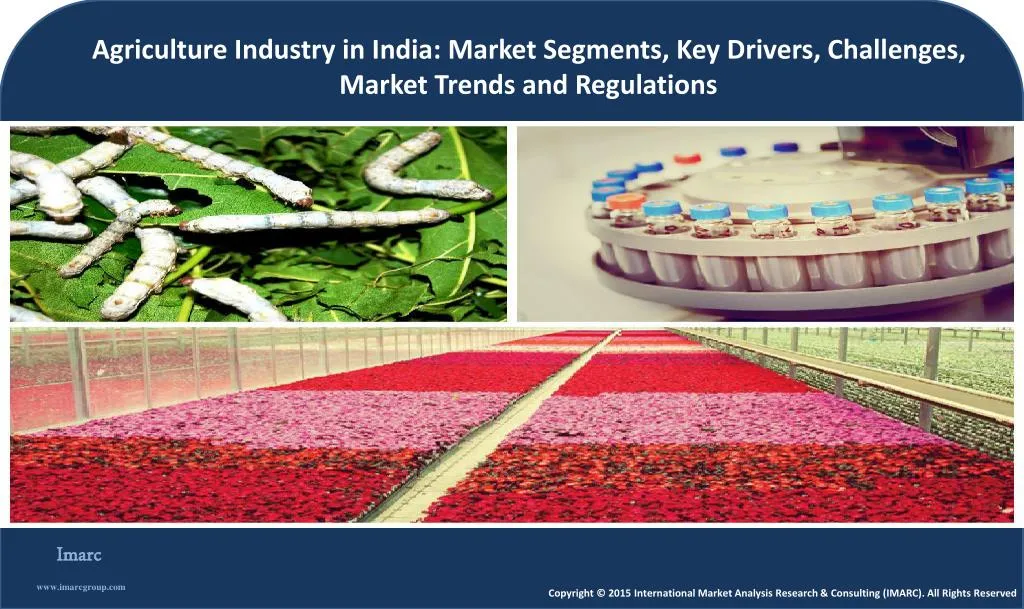
Agriculture Industry in India: Market Segments, Key Drivers, Challenges, Market Trends and Regulations Agriculture Industry in India: Market Segments, Key Drivers, Challenges, Market Trends and Regulations Imarc Imarc www.imarcgroup.com 1 Copyright © 2015 International Market Analysis Research & Consulting (IMARC). All Rights Reserved
About IMARC Group The International Market Analysis Research and Consulting Group is a leading advisor on management strategy and market research worldwide. We partner with clients in all sectors and regions to identify their highest-value opportunities, address their most critical challenges, and transform their businesses. IMARC’s information products include major market, scientific, economic and technological developments for business leaders in pharmaceutical, industrial, and high technology organizations. Market forecasts and industry analysis for biotechnology, advanced materials, pharmaceuticals, food and beverage, travel and tourism, nanotechnology and novel processing methods are at the top of the company’s expertise. IMARC’s tailored approach combines unfathomable insight into the dynamics of companies and markets with close cooperation at all levels of the client organization. This ensures that our clients achieve unmatchable competitive advantage, build more proficient organizations, and secure lasting results. 2
Imarc Imarc www.imarcgroup.com Executive Summary Floriculture, Sericulture and Cold Chains Represent the Fastest Growing Agriculture Segments in India A new report finds that the overall agriculture market in India grew at a CAGR of around 14% during 2007-2014. Farming, food processing and dairy represented the three largest segments, whereas floriculture, sericulture and cold chains represented the three fastest growing segments in the Indian agriculture industry. Being the world’s second largest populated country, India provides a huge consumer base for agricultural products. Despite a significant increase in industrialization levels, agriculture continues to play an important role in the Indian economy in terms of GDP as well as employment. Agriculture continues to be the primary source of livelihood for around 65% of the country’s total population and is critical in meeting the food consumption needs of more than 1.25 Billion people. India is also among the 15 leading exporters of agricultural products in the world. A number of factors have been acting as a catalyst in driving the growth of the Indian agriculture industry. These include: population growth, rising income levels, technological advancements in irrigation facilities, mechanization of farm equipments, etc. The Indian government has also recognized the importance of agriculture and has taken several steps for its sustainable development. These include - enhanced institutional credits to farmers, increasing MSP’s (Minimum Support Prices), promotion of cold chain infrastructure to increase the shelf-life of farm produce, FDI (Foreign Direct Investment), RKVY (Rashtriya Krishi Vikas Yojana), etc. 3
Imarc Imarc www.imarcgroup.com Report Description and Highlights A new report by IMARC Group titled, “Agriculture Industry in India: Market Segments, Key Drivers, Challenges, Market Trends and Regulations” finds that the overall agriculture market in the country grew at a CAGR of around 14% during 2007-2014. The report also found that farming, food processing and dairy currently represent the three largest segments in the entire agriculture market. Floriculture, sericulture and cold chains, on the other hand, represented the three fastest growing segments. This report provides a comprehensive understanding of the Indian agriculture industry and serves as an analytical tool to understand not only the market trends, structure, drivers and restraints but also the outlook of the market till 2020. This report aims to serve as an excellent guide for investors, researchers, consultants, marketing strategists, and all those who are planning to foray into the Indian agriculture market in any form. What We Have Achieved in this Report • • • • Comprehensive situation analysis of the Indian agriculture market and its dynamics. Identifying all application segments/sub-segments and quantifying their current and future market potential. Providing robust long range value and volume forecasts for all segments and sub-segments. Providing an understanding of key drivers and restraints and their impact on current and future market scenario. Agricultural Segments Covered in this Report • • • • • Farming Agriculture Equipments Fertilizers Pesticides Warehousing 4
Imarc Imarc www.imarcgroup.com Report Description and Highlights • • • • • • • • • • • • Cold Chains Food Processing Dairy Farming Floriculture Apiculture Sericulture Seeds Fisheries Poultry Animal Husbandry Animal Feed Bioagriculture Focus of the Analysis for Each Segment and Sub-Segment • • • • • • Drivers and Challenges Historical, Current and Future Market Values Historical, Current and Future Market Volumes Analysis of Various Sub-Segments Areas of Opportunity Competitive Landscape 5
Imarc Imarc www.imarcgroup.com Agriculture Industry in India 6
Imarc Imarc www.imarcgroup.com Report Description and Highlights Table of Contents 1 Research Methodology and Market Definitions 2 Executive Summary 3 Drivers and Challenges 3.1 Drivers 3.1.1 Huge Consumer Base and Rising Incomes 3.1.2 Easy Availability of Credit 3.1.3 Emergence of Contract Farming 3.1.4 Growth of Organized Food Retail 3.1.5 Government Support 3.2 Challenges 3.2.1 Low Agricultural Yield 3.2.2 Small Land Holdings 3.2.3 Poor Logistics Infrastructure 3.2.4 Unsatisfactory Spread of New Technology 4 Indian Agriculture Market 4.1 Current Market Trends 4.2 Market Forecast 5 Insight on Various Subsectors 5.1 Farming 5.1.1 Current Market Trends 5.1.2 Market Breakup by Segment 5.1.3 Competitive Landscape 5.1.4 Market Forecast 5.2 Agriculture Equipments 7
Imarc Imarc www.imarcgroup.com Report Description and Highlights 5.2.1 Current Market Trends 5.2.2 Market Breakup by Segment 5.2.3 Competitive Landscape 5.2.4 Market Forecast 5.3 Fertilizers 5.3.1 Current Market Trends 5.3.2 Market Breakup by Segment 5.3.3 Competitive Landscape 5.3.4 Market Forecast 5.4 Pesticides 5.4.1 Current Market Trends 5.4.2 Market Breakup by Segment 5.4.3 Competitive Landscape 5.4.4 Market Forecast 5.5 Warehousing 5.5.1 Current Market Trends 5.5.2 Market Breakup by Segment 5.5.3 Competitive Landscape 5.5.4 Market Forecast 5.6 Cold Chains 5.6.1 Current Market Trends 5.6.2 Market Breakup by Segment 5.6.3 Competitive Landscape 5.6.4 Market Forecast 5.7 Food Processing 5.7.1 Current Market Trends 8
Imarc Imarc www.imarcgroup.com Report Description and Highlights 5.7.2 Market Breakup by Segment 5.7.3 Competitive Landscape 5.7.4 Market Forecast 5.8 Dairy Market 5.8.1 Current Market Trends 5.8.2 Market Breakup by Segment 5.8.3 Competitive landscape 5.8.4 Market Forecast 5.9 Floriculture 5.9.1 Current Market Trends 5.9.2 Market Breakup by Segment 5.9.3 Competitive Landscape 5.9.4 Market Forecast 5.10 Apiculture 5.10.1 Current Market Trends 5.10.2 Market Breakup by Segment 5.10.3 Competitive Landscape 5.10.4 Market Forecast 5.11 Sericulture 5.11.1 Current Market Trends 5.11.2 Market Breakup by Segment 5.11.3 Competitive Landscape 5.11.4 Market Forecast 5.12 Seeds 5.12.1 Current Market Trends 5.12.2 Market Breakup by Segment 9
Imarc Imarc www.imarcgroup.com Report Description and Highlights 5.12.3 Competitive landscape 5.12.4 Market Forecast 5.13 Fisheries 5.13.1 Current Market Trends 5.13.2 Market Breakup by Segment 5.13.3 Competitive Landscape 5.13.4 Market Forecast 5.14 Poultry 5.14.1 Current Market Trends 5.14.2 Market Breakup by Segment 5.14.3 Competitive Landscape 5.14.4 Market Forecast 5.15 Animal Husbandry 5.15.1 Current Market Trends 5.15.2 Market Breakup by Segment 5.15.3 Competitive Landscape 5.15.4 Market Forecast 5.16 Animal Feed 5.16.1 Current Market Trends 5.16.2 Market Breakup by Segment 5.16.3 Competitive Landscape 5.16.4 Market Forecast 5.17 Bioagriculture market 5.17.1 Current Market Trends 5.17.2 Market Breakup by Segment 5.17.3 Competitive Landscape 10
Imarc Imarc www.imarcgroup.com Report Description and Highlights 5.17.4 Market Forecast 6 Regulations and Marketing 6.1 Major Laws Governing Food Products 6.2 Import Procedure 6.3 Documentation 6.4 Packaging Requirements 6.5 Duties 6.6 Distribution and Logistics 6.7 Strategies for Market Entry List of Figures Figure 3 1: India - Population (in Billion), 2014 & 2020 Figure 3 2: India - Rising Incomes, 2005 & 2014 Figure 3 3: India - Microfinance Customers, (in Millions), 2006-07 - 2014-15 Figure 3 4: India - Profitability of Contract & Non Contract Farming Figure 3 5: India - Organized Food Retail Market - Consumption Value (in Billion INR), 2013-14 - 2020-21 Figure 3 6: India - Share (%) of Farmers by Land Holdings Size (in Hectares), 1995-96, 2000-01 & 2014-15 Figure 4 1: India - Agriculture Market - Consumption Value (in Billion INR), 2007-08 – 2014-15 Figure 4 2: India - Agriculture Market - Consumption Value by Segment (in %), 2014-15 Figure 4 3: India - Agriculture Market Forecast - Consumption Value (in Billion INR), 2015-16 - 2020-21 Figure 4 4: India - Agriculture Market Forecast - Consumption Value by Segment (in %), 2020-21 Figure 5 1: India - Farming Market - Production Volume (in Million Metric Tons), 2007-08 - 2014-15 Figure 5 2: India - Farming Market - Production Value (in Billion INR), 2007-08 - 2014-15 Figure 5 3: India - Farming Market - Consumption Volume (in Million Metric Tons), 2007-08 - 2014-15 Figure 5 4: India - Farming Market - Consumption Value (in Billion INR), 2007-08 - 2014-15 11
Imarc Imarc www.imarcgroup.com Report Description and Highlights Figure 5 5: India - Farming Market - Consumption Volume Share by Segment (in %), 2007-08- 2014-15 Figure 5 6: India - Farming Market - Consumption Value Share by Segment (in %), 2007-08 - 2014-15 Figure 5 7: India - Farming Market Forecast - Consumption Volume (in Million Metric Tons), 2015-16 - 2020-21 Figure 5 8: India - Farming Market Forecast - Consumption Value (in Billion INR), 2015-16 – 2020-21 Figure 5 9: India - Farming Market Forecast - Consumption Volume Share by Segment (in %), 2015-16 – 2020-21 Figure 5 10: India - Farming Market Forecast - Consumption Value Share by Segment (in %), 2015-16 - 2020-21 Figure 5 11: India - Agriculture Equipments Market - Consumption Value (in Billion INR), 2007-08 – 2014-15 Figure 5 12: India - Share of Various Sources providing Power to Agricultural Activities, 1971-72 - 2014-15 Figure 5 13: India - Agriculture Equipments Market - Value Share by Segment (in %), 2014-15 Figure 5 14: India - Tractor Market - Volume Share of Various Players (in %), 2007-08 - 2014-15 Figure 5 15: India - Penetration Levels of Various Agriculture Equipments Figure 5 16: India - Agriculture Equipments Market Forecast - Sales Value (in Billion INR), 2015-16 - 2020-21 Figure 5 17: India - Fertilizer Market - Consumption Volume (in 000’ Metric Tons), 2007-08- 2014-15 Figure 5 18: India - Fertilizer Market - Consumption Value (in Billion INR), 2007-08 - 2014-15 Figure 5 19: India - Fertilizer Market - Average Prices (in INR Per Metric Ton), 2007-08 - 2014-15 Figure 5 20: India - Fertilizer Market – Consumption Volume Share by Segment (in %), 2007-08 - 2014-15 Figure 5 21: India - Fertilizer Market – Consumption Value Share by Segment (in %), 2007-08 - 2014-15 Figure 5 22: India - Fertilizer Market - Intensity of Fertilizer Consumption by Region (in Kg/Hectare), 1971-72 - 2014-15 Figure 5 23: India - Fertilizer Market - Fertilizer Usage by Various States (Kg/Hectare), TE 2014-15 Figure 5 24: India - Fertilizer Market - Consumption Volume Forecast (in 000’ Metric Tons), 2015–16 - 2020-21 Figure 5 25: India - Fertilizers Market - Consumption Value Forecast (in Billion INR), 2015-16 - 2020-21 Figure 5 26: India - Pesticides Market - Losses Caused by Different pests (%), 2014-15 Figure 5 27: India - Pesticides Market - Consumption Volume (in 000’ Metric Tons), 2007-08 - 2014-15 Figure 5 28: India - Pesticides Market - Consumption Value (in Billion INR), 2007-08 - 2014-15 Figure 5 29: India - Pesticides Market - Consumption Volume Breakup by Segment (in %), 2007-08 - 2014-15 Figure 5 30: India - Pesticides Market - Crop Wise Pesticides Consumption (in %), 2014-15 12
Imarc Imarc www.imarcgroup.com Report Description and Highlights Figure 5 31: India - Pesticides Market - Consumption Volume Breakup by State (in %) Figure 5 32: India vs Other Countries - Average Pesticide Usage (in kg/hectare) Figure 5 33: India - Pesticides Market - Consumption Volume Forecast (in 000’ Metric Tons), 2015-16 - 2020-21 Figure 5 34: India - Pesticides Market - Consumption Value Forecast (in Billion INR), 2015-16 - 2020-21 Figure 5 35: India - Pesticides Market Forecast - Consumption Volume Breakup by Segment (in %), 2014-15 - 2020-21 Figure 5 36: India - Warehousing Market - Sales Value (in INR Billion), 2007-08 - 2014-15 Figure 5 37: India - Warehousing Market - Value Share by Segment, 2009-10, 2014-15 & 2020-21 Figure 5 38: India - Warehousing Market - Value Share by Segment (in %), 2014-15 Figure 5 39: India - Warehousing Market – Competitive Structure, (in %) Figure 5 40: India - Warehousing Market Forecast - Sales Value (in INR Billion), 2015-16 - 2020-21 Figure 5 41: India - Warehousing Market Forecast - Value Share by Segment (in %), 2020-21 Figure 5 42: India - Cold Chain Market - Sales Value (in INR Billion), 2007-08 – 2014-15 Figure 5 43: India - Cold Chain Market - Installed Capacity (in Million Metric Tons), 2007-08 - 2014-15 Figure 5 44: India - Cold Chain Market - Sales Breakup by Segment, (in %), 2007-08 - 2014-15 Figure 5 45: India - Cold Chain Storage Market - Value & Volume Share by Commodity (in %) Figure 5 46: India - Cold Chain Market Forecast - Sales Value (in INR Billion), 2015-16 - 2020-21 Figure 5 47: India - Cold Chain Market Forecast - Sales Volume (in Million Metric Tons), 2015-16 - 2020-21 Figure 5 48: India - Cold Chain Market Forecast - Sales Breakup by Segment, (in %), 2015-16 – 2020-21 Figure 5 49: India - Food Processing Market - Sales Value (in Billion INR), 2007-08 - 2014-15 Figure 5 50: India - Food Processing Market - Food Processing Share in Manufacturing (in %) Figure 5 51: India - Food Processing Market - Sales Value Forecast (in Billion INR), 2015-16 - 2020-21 Figure 5 52: India - Dairy Production and Consumption, by Volume, 2010-11 - 2014-15 Figure 5 53: India - Utilization Patterns of Milk & Milk Products, (in %), 2014-15 Figure 5 54: India - Dairy Market - Consumption Volume (in Million Kgs), 2007-08 - 2014-15 Figure 5 55: India - Dairy Market - Consumption Value (in Billion INR), 2007-08 - 2014-15 Figure 5 56: India - Sales Value Penetration of the Organized Sector in Key Dairy Categories, (In %), 2014-15 & 2020-21 13
Imarc Imarc www.imarcgroup.com Report Description and Highlights Figure 5 57: India - Production & Consumption Forecast of Milk (in Million Metric Tons), 2014-15 - 2020-21 Figure 5 58: India - Dairy Market Forecast - Consumption Volume Forecast (in Million Kgs), 2015-16 - 2020-21 Figure 5 59: India - Dairy Market Forecast - Consumption Value Forecast (in Billion INR), 2015-16 - 2020-21 Figure 5 60: India - Floriculture Market - Consumption Value (in Billion INR), 2007-08 - 2014-15 Figure 5 61: India - Floriculture Market - Area under Cultivation (in 000’ Hectare), 2007-08 - 2014-15 Figure 5 62: India - Floriculture Market - Area under Cultivation by State (in %), 2014-15 Figure 5 63: India - Floriculture Market - Production Volume of Cut Flowers (in Million Flowers), 2007-08- 2014-15 Figure 5 64: India - Floriculture Market - Major Cut Flower Producing States (in %), 2014-15 Figure 5 65: India - Floriculture Market - Production Volume of Loose Flowers (in 000’ Metric Tons), 2007-08 - 2014-15 Figure 5 66: India - Floriculture Market - Major Loose Flower Producing States (in %), 2014-15 Figure 5 67: India - Floriculture Market Forecast - Consumption Value (in Billion INR), 2015-16 – 2020-21 Figure 5 68: India - Apiculture Market - Consumption Volume (in Metric Tons), 2007-08 - 2014-15 Figure 5 69: India - Apiculture Market - Consumption Value (in INR Million), 2007-08 - 2014-15 Figure 5 70: India - Apiculture Market - Consumption Volume Share by Segment (in %), 2007-08 - 2014-15 Figure 5 71: India - Apiculture Market - Consumption Value Share by Segment (in %), 2007-08 - 2014-15 Figure 5 72: India - Apiculture Market – Consumption Volume Breakup of Organized & Unorganized Markets (in %), 2014-15 Figure 5 73: India - Apiculture Market – Consumption Value Breakup of Organized & Unorganized Markets (in %), 2014-15 Figure 5 74: India - Apiculture Market Forecast - Consumption Volume (in Metric Tons), 2015-16 - 2020-21 Figure 5 75: India - Apiculture Market Forecast - Consumption Value (in INR Million), 2015-16 - 2020-21 Figure 5 76: India - Sericulture Market - Consumption Volume (in Metric Tons), 2007-08 - 2014-15 Figure 5 77: India - Sericulture Market - Consumption Value (in Billion INR), 2007-08 - 2014-15 Figure 5 78: India - Sericulture Market - Production Volume by Segment (in %), 2007-08 - 2014-15 Figure 5 79: India - Sericulture Market - Production Value by Segment (in %), 2007-08 - 2014-15 Figure 5 80: India - Sericulture Market - Mulberry Silk Production Volumes by State (in %), 2014-15 Figure 5 81: India - Sericulture Market - Vanya Silk Production Volumes by State (in %), 2014-15 Figure 5 82: India - Sericulture Market - Export of Silk Goods (in INR Billion), 2007-08- 2014-15 14
Imarc Imarc www.imarcgroup.com Report Description and Highlights Figure 5 83: India - Sericulture Market - Mulberry Silk Production Volume by State (in %), 2014-15 Figure 5 84: India - Sericulture Market Forecast - Consumption Volume (in Metric Tons), 2015-16 - 2020-21 Figure 5 85: India - Sericulture Market Forecast - Consumption Value (in Billion INR), 2015-16 - 2020-21 Figure 5 86: India - Evolution of the Seed Industry Figure 5 87: India - Seeds Market - Sales Value (in Billion INR), 2007-08 - 2014-15 Figure 5 88: India - Seeds Market - Volume Breakup by Type of Certified Seeds (in %), 2007-08 - 2014-15 Figure 5 89: India - Seeds Market - Competitive Landscape, 2014-2015 Figure 5 90: India - Seeds Market Forecast – Sales Value (in Billion INR), 2015-16 - 2020-21 Figure 5 91: India - Fisheries Market - Consumption Volume (in 000’ Metric Tons), 2007-08 - 2014-15 Figure 5 92: India - Fisheries Market - Consumption Value (in Billion INR), 2007-08 - 2014-15 Figure 5 93: India - Fisheries Market - Production Volume Share by Segment (in %), 2007-08 - 2014-15 Figure 5 94: India - Fisheries Market - State-Wise Fish Production (in %), 2007-08 – 2014-15 Figure 5 95: India - Fisheries Market Forecast - Consumption Volume (in 000’ Metric Tons), 2015-16 - 2020-21 Figure 5 96: India - Fisheries Market Forecast - Consumption Value (in Billion INR), 2015-16 - 2020-21 Figure 5 97: India - Poultry Market - Consumption Volume (in 000’ Metric Tons), 2007-08 - 2014-15 Figure 5 98: India - Poultry Market - Consumption Value (in Billion INR), 2007-08 - 2014-15 Figure 5 99: India - Poultry Market – Consumption Volume Share by Segment (in %), 2007-08 - 2014-15 Figure 5 100: India - Poultry Market – Consumption Value Share by Segment (in %), 2007-08 - 2014-15 Figure 5 101: India - Poultry Market - Breakup by Sector, (in %), 2014-15 Figure 5 102: India - Per Capita Consumption of Broiler Meat & Eggs (in kg per year), 2014-15 - 2020-21 Figure 5 103: India - Poultry Market Forecast - Consumption Volume (in 000’ Metric Tons), 2015-16 - 2020-21 Figure 5 104: India - Poultry Market Forecast - Consumption Value (in Billion INR), 2015-16 - 2020-21 Figure 5 105: India - Poultry Market Forecast – Consumption Volume Share by Segment (in %), 2015-16 – 2020-21 Figure 5 106: India - Poultry Market Forecast – Consumption Value Share by Segment (in %), 2015-16 - 2020-21 Figure 5 107: India - Animal Husbandry Market - Consumption Value (in Billion INR), 2007-08 - 2014-15 Figure 5 108: India - Animal Husbandry Market - Consumption Value Share by Segment (in %), 2007-08 - 2014-15 15
Imarc Imarc www.imarcgroup.com Report Description and Highlights Figure 5 109: India - Animal Husbandry Market Forecast - Consumption Value (in Billion INR), 2015-16 – 2020-21 Figure 5 110: India - Animal Husbandry Market Forecast - Consumption Value Share by Segment (in %), 2015-16 - 2020-21 Figure 5 111: India - Animal Feed Market - Consumption Volume (in Million Tons), 2007-08 – 2014-15 Figure 5 112: India - Bio agriculture Market- Consumption Value Breakup (in INR Million), 2015-16 - 2020-21 List of Tables Table 1-1: India - Agriculture Market Definitions Table 2-1: India - Agriculture Market - Consumption Value by Segment (in INR Billion), Table 2-2: India - Agricultural Market Forecast - Consumption Value by Segment (in INR Billion), Table 3-1: India - Share of Farm Credit by Various Sources (in %), 1951 - 2010 Table 3-2: India & Major Countries - Comparison of Yield in Selected Commodities, (in Metric Tons/Hectare) Table 4-1: India - Share of Agriculture in GDP & Employment (in %), 1980-81 – 2014-15 Table 4-2: India - Agricultural Market - Consumption Value by Segment (in INR Billion), 2007-08 - 2014-15 Table 4-3: India - Agriculture Market Forecast - Consumption Value by Segment (in INR Billion), Table 5-1: India - Growth in Average Yields of Major Crops (in Kg per Hectare), Table 5-2: India - Overview of Various Cropping Seasons Table 5-3: India - Farming Market - Segmentation of Various Sectors in the Industry Table 5-4: India - Farming Market - Consumption Volume by Segment (in Million Metric Tons), Table 5-5: India - Farming Market - Consumption Value by Segment (in INR Billion), Table 5-6: India - Organized Food Retailers - Total Number of Outlets & Retail Space, 2006-07, Table 5-7: India - Sales of Major Food Retailers (in INR Million), 2004 - 2014 Table 5-8: India - Farming Market Forecast - Consumption Volume by Segment (in Million Metric Tons), 2015-16 - 2020-21 Table 5-9: India - Farming Market Forecast - Consumption Value by Segment (in INR Billion), 2015-16 - 2020-21 Table 5-10: India - Farming Practices - Past & Current Table 5-11: India - Agriculture Industry Value Chain & Equipments Used 16
Imarc Imarc www.imarcgroup.com Report Description and Highlights Table 5-12: India - Tractor Market - Sales & Volume, 2007-08 – 2014-15 Table 5-13: India - Agriculture Equipments Market - Regions Having the Highest Concentration Table 5-14: India - Relation between Fertilizer Usage & Food Production Table 5-15: India - Fertilizer Market - Consumption Volume Breakup by Segment (in 000’ Metric Tons), 2007-08- 2014-15 Table 5-16: India - Fertilizer Market - Consumption Value Breakup by Segment (in Billion INR), 2007-08 - 2014-15 Table 5-17: India - Fertilizer Market - Price by Type of Fertilizer (in INR per Metric Ton), 2007-08 - 2014-15 Table 5-18: India - Fertilizer Market - Installed Production Capacity Breakup by Sector, 2014 Table 5-19: India - Key Fertilizer Companies Table 5-20: India - Pesticides Market - Consumption Volume Breakup by Segment (in 000’ Metric Tons), 2007-08 - 2014-15 Table 5-21: India - Pesticides Market - Crop Wise Applications of Various Pesticides Table 5-22: India - Pesticides Market - Consumption Volume Breakup by State (in Metric Tons), 2006-07 - 2014-15 Table 5-23: India - Pesticides Market - Key Companies Table 5-24: India - Pesticides Market Forecast - Consumption Volume Breakup by Segment (in 000’ Metric Tons), 2015-16 - 2020-21 Table 5-25: India - Warehousing Market - Sales Value Breakup by Segment, (in INR Billion), 2007-08 - 2014-15 Table 5-26: India - Warehousing Market Forecast - Sales Value Breakup by Segment (in INR Billion), 2015-16 - 2020-21 Table 5-27: India - Cold Chain Market - Sales Breakup by Segment, (in INR Billion), 2007-08 - 2014-15 Table 5-28: India - Cold Chain Storage Market - Volume Breakup by Commodity (in Metric Tons) Table 5-29: India - Cold Chain Storage Market - Volume Breakup by State (in Metric Tons) Table 5-30: India - Cold Chain Storage Market – Installed Capacity Breakup by Sector Table 5-31: India - Various Types of Cold Chain Service Providers Table 5-32: India - Cold Chain Market - Recent Private Sector Participation Table 5-33: India - Cold Chain Market - Overview of Key Cold Chain Service Providers Table 5-34: India - Cold Chain Market Forecast - Sales Breakup by Segment, (in INR Billion), 2015-16 - 2020-21 Table 5-35: India - Food Processing Market - Segmentation of Various Sectors in the Industry Table 5-36: India - Food Processing Market – Profile of Various Segments Table 5-37: India - Food Processing Units in the Organized Sector Table 5-38: India - Food Processing Market - Key Players & Their Product Portfolio 17
Imarc Imarc www.imarcgroup.com Report Description and Highlights Table 5-39: India - Dairy Market - Volume Breakup by Segment (in Million Kgs), 2012-13 - 2014-15 Table 5-40: India - Dairy Market - Value Breakup by Segment (in Billion INR), 2012-13 - 2014-15 Table 5-41: India - Milk Production - Volume Breakup by State (in 000’ Metric Tons), 2007-08 - 2014-15 Table 5-42: India - Dairy Market - Profiles of Key Players Table 5-43: India - Dairy Market Forecast - Volume Breakup by Segment (in Million Kgs), 2015-16 - 2020-21 Table 5-44: India - Dairy Market Forecast - Value Breakup by Segment (in Billion INR), 2015-16 - 2020-21 Table 5-45: India - Floriculture Market, Key Players Table 5-46: India - Apiculture Market - Consumption Volume Breakup by Segment (in Metric Tons), 2007-08 - 2014-15 Table 5-47: India - Apiculture Market - Consumption Value Breakup by Segment (in INR Million), 2007-08 - 2014-15 Table 5-48: India - Apiculture Market – Consumption Volume Breakup of Organized & Unorganized Markets (in Metric Tons), 2007-08 - 2014-15 Table 5-49: India - Apiculture Market – Consumption Value Breakup of Organized & Unorganized Markets (in INR Million), 2007-08 - 2014- 15 Table 5-50: India - Apiculture Market Forecast - Consumption Volume by Segment (in Metric Tons), 2015-16 - 2020-21 Table 5-51: India - Apiculture Market Forecast - Consumption Value by Segment (in INR Million), 2015-16 - 2020-21 Table 5-52: India - Apiculture Market Forecast – Consumption Volume Breakup of Organized & Unorganized Markets (in Metric Tons), 2015- 16 - 2020-21 Table 5-53: India - Apiculture Market Forecast – Consumption Value Breakup 2015-16 - 2020-21 Table 5-54: India - Sericulture Market – Breakup of Domestic Production & Imports (in Metric Tons), 2007-08 - 2014-15 Table 5-55: India - Sericulture Market – Breakup of Domestic Production & Imports (in Billion INR), 2007-08 - 2014-15 Table 5-56: India - Sericulture Market – Production Volume by Segment (in Metric Tons), 2007-08 - 2014-15 Table 5-57: India - Sericulture Market – Production Value by Segment (in Billion INR), 2007-08 - 2014-15 Table 5-58: India - Sericulture Market – Raw Silk Prices by Segment (in INR per kg), 2007-08 - 2014-15 Table 5-59: India - Sericulture Infrastructure & Employment Statistics Table 5-60: India - Seeds Market - Volume Breakup by Type of Seeds (in 000’ Metric Tons), 2007-08 - 2014-15 Table 5-61: India - Seeds Market - Volume Breakup by Type of Certified Seeds (in 000’ Metric Tons), 2007-08 - 2014-15 18
Imarc Imarc www.imarcgroup.com Report Description and Highlights Table 5-62: India - Seeds Market - Top Private Companies Table 5-63: India - Seeds Market - Seed Replacement Rate of Various Crops (in %), 2005-2014 Table 5-64: India - Fisheries Market - Production Volume Breakup by Segment (in 000’ Metric Tons), 2007-08- 2014-15 Table 5-65: India - Fisheries Market – State Wise Fish Production (in 000’ Metric Tons), 2007-08 - 2014-15 Table 5-66: India - Fisheries Market - Key Players Table 5-67: India - Poultry Market – Consumption Volume Breakup by Segment (in 000’ Metric Tons), 2007-08 - 2014-15 Table 5-68: India - Poultry Market - Consumption Value Breakup by Segment (in INR Billion), 2007-08 - 2014-15 Table 5-69: India - Poultry Market - Production Volume Breakup by State (in %), 2014-15 Table 5-70: India - Poultry Meat Forecast – Consumption Volume Breakup by Segment (in 000’ Metric Tons), 2015-16 - 2020-21 Table 5-71: India - Poultry Meat Forecast - Consumption Value Breakup by Segment (in INR Billion), 2015-16 - 2020-21 Table 5-72: India - Animal Husbandry Market - Consumption Value by Segment (in Billion INR), 2007-08- 2014-15 Table 5-73: India - Animal Husbandry Market - Key Players Table 5-74: India - Market Forecast - Consumption Value by Segment (in Billion INR), 2015-16 - 2020-21 Table 5-75: India - Animal Feed Market Segmentation Table 5-76: India - Animal Feed Market - Consumption Volume Breakup by Segment (in Million Tons), 2007-08 - 2014-15 Table 5-77- Animal Feed Market - Consumption Value Breakup by Segment (in Million INR), 2007-08 - 2014-15 Table 5-78: India - Animal Feed Market - Consumption Volume Breakup by Segment (in Million Tons), 2015-16 - 2020-21 Table 5-79: India - Bioagriculture Market- Consumption Value Breakup (INR), 2007-08 - 2014-15 Table 5-80: India - Bioagriculture Market -Consumption Volume Breakup (in Metric Tons), 2007-08 - 2014-15 Table 5-81: India - Bioagriculture Market- Key players of BT cotton Table 5-82: Consumption Volume Breakup (in Metric Tons), 2015-16 - 2020-21 Table 5-83: India -Bioagriculture Market Consumption Value Breakup (in INR Million), 2015-16 – 2020-21 Table 6-1: India - Import Duties on Various Food Products 19
Imarc Imarc www.imarcgroup.com Report Description and Highlights To buy the complete report or to get a free sample, please contact: IMARC Group Asia: Email: apac@imarcgroup.com Phone: +91-120-415-5099 IMARC Group North America: Email: america@imarcgroup.com Phone: +1-631-791-1145 IMARC Group Europe, Middle East & Africa: Email: ema@imarcgroup.com Phone: +44-702-409-7331 To know more please visit: http://www.imarcgroup.com/agriculture-industry-in-india 20
Imarc Imarc www.imarcgroup.com Browse Related Reports Dairy Industry in India: Market Size, Growth, Prices, Segments, Cooperatives, Private Dairies, Procurement and Distribution - http://www.imarcgroup.com/dairy-industry-in-india Biofertilizer (Azotobacter and Rhizobium) Manufacturing Plant Project Report: Industry Trends, Manufacturing Process, Machinery, Raw Materials, Cost and Revenue - http://www.imarcgroup.com/biofertilizer-azotobacter-and-rhizobium-manufacturing-plant Indian Floriculture Market Report & Forecast: 2012-2017 - http://www.imarcgroup.com/flower-floriculture- industry-india Indian Agrochemicals Market Report & Forecast: 2012-2017 - http://www.imarcgroup.com/fertilizer- pesticide-agrochemical-industry-india 21
Imarc Imarc www.imarcgroup.com Report Description and Highlights © 2015 IMARC All Rights Reserved This Publication and all it’s contents unless otherwise mentioned are copyrighted in the name of International Market Analysis Research and Consulting (IMARC). No part of this publication may be reproduced, repackaged, redistributed or resold in whole or in any part. The publication may also not be used in any form or by and means graphic electronic or mechanical, including photocopying, recording, taping or by information storage or retrieval, or by any other form, without the express consent of International Market Analysis Research and Consulting (IMARC). Disclaimer: All contents and data of this publication, including forecasts, data analysis and opinion have been based on information and sources believed to be accurate and reliable at the time of publishing. International Market Analysis Research and Consulting makes no representation of warranty of any kind as to the accuracy or completeness of any Information provided. IMARC accepts no liability whatsoever for any loss or damage resulting from opinion, errors or inaccuracies if any found this publication. IMARC, IMARC Group and Global Therapy Insight Series are registered trademarks of International Market Analysis Research and Consulting. All other trademarks used in this publication are registered trademarks of their respective companies. 22