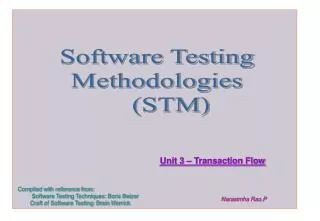
Download

1 / 31
310 likes | 316 Views
This presentation is about Software Design Methodologies and Testing. Its presented by Professor Prashant J. Gadakh from the department of Computer Engineering at International Institute of Information Technology, Iu00b2IT. The presentation starts with an Introduction To Software Design, different Stages of Design and Design Process, Phases in the Design Process, Procedural design methodology, different levels of Data Flow Diagrams (DFD), Difference Between DFD & Flow Chart and more!

E N D
Software Design Methodologies and Testing Prof. Prashant J. Gadakh Assistant Professor Department of Computer Engineering Hope Foundation’s International Institute of Information Technology, (I²IT). www.isquareit.edu.in
Design Concept Hope Foundation’s International Institute of Information Technology, I²IT P-14,Rajiv Gandhi Infotech Park MIDC Phase 1, Hinjawadi, Pune – 411057 Tel - +91 20 22933441/2/3 | www.isquareit.edu.in | info@isquareit.edu.in
Introduction To Software Design • Deriving a solution which satisfies software requirements. • Software Design is a procedure of portraying, sorting out and organizing the parts of a framework. • Software Design are like set of blueprints in which various components of the system are shown. Hope Foundation’s International Institute of Information Technology, I²IT P-14,Rajiv Gandhi Infotech Park MIDC Phase 1, Hinjawadi, Pune – 411057 Tel - +91 20 22933441/2/3 | www.isquareit.edu.in | info@isquareit.edu.in
Stages of Design • Problem understanding • Problem understanding means Look at the problem from different angles to discover the design requirements in deatils. • Identify one or more solutions • Evaluate possible solutions and choose the most appropriate depending on the designer's experience and available resources. Hope Foundation’s International Institute of Information Technology, I²IT P-14,Rajiv Gandhi Infotech Park MIDC Phase 1, Hinjawadi, Pune – 411057 Tel - +91 20 22933441/2/3 | www.isquareit.edu.in | info@isquareit.edu.in
Stages of Design (Cont..) • Describe solution abstractions • Use graphical, formal or other descriptive notations by taking the help of UML to describe the components of the design. • Repeat process for each identified abstraction Until the design is expressed in primitive terms. Hope Foundation’s International Institute of Information Technology, I²IT P-14,Rajiv Gandhi Infotech Park MIDC Phase 1, Hinjawadi, Pune – 411057 Tel - +91 20 22933441/2/3 | www.isquareit.edu.in | info@isquareit.edu.in
The Design Process • Any design may be modeled as a directed graph made up of entities with attributes which participate in relationships. • The system should be described at several different levels of abstraction. • Design takes place in overlapping stages. It is artificial to separate it into distinct phases but some separation is usually necessary. Hope Foundation’s International Institute of Information Technology, I²IT P-14,Rajiv Gandhi Infotech Park MIDC Phase 1, Hinjawadi, Pune – 411057 Tel - +91 20 22933441/2/3 | www.isquareit.edu.in | info@isquareit.edu.in
Phases in the Design Process Hope Foundation’s International Institute of Information Technology, I²IT P-14,Rajiv Gandhi Infotech Park MIDC Phase 1, Hinjawadi, Pune – 411057 Tel - +91 20 22933441/2/3 | www.isquareit.edu.in | info@isquareit.edu.in
PROCEDURAL DESIGN METHODOLOGY • A design methodology combines a systematic set of rules for creating a program design with diagramming tools needed to represent it. • Procedural design is best used to model programs that have an undeniable stream of information from contribution to yield. • It speaks to the engineering of a program as a lot of cooperating forms that pass information starting with one then onto the next Hope Foundation’s International Institute of Information Technology, I²IT P-14,Rajiv Gandhi Infotech Park MIDC Phase 1, Hinjawadi, Pune – 411057 Tel - +91 20 22933441/2/3 | www.isquareit.edu.in | info@isquareit.edu.in
Design Tools • The two major diagramming tools used in procedural design are as follows. • Data Flow Diagrams • Structure Charts (Flow Chart). Hope Foundation’s International Institute of Information Technology, I²IT P-14,Rajiv Gandhi Infotech Park MIDC Phase 1, Hinjawadi, Pune – 411057 Tel - +91 20 22933441/2/3 | www.isquareit.edu.in | info@isquareit.edu.in
Data Flow Diagrams • A data flow diagram (or DFD) is a tool to help you discover and document the program’s major processes. The following table shows the symbols used and what each represents. Hope Foundation’s International Institute of Information Technology, I²IT P-14,Rajiv Gandhi Infotech Park MIDC Phase 1, Hinjawadi, Pune – 411057 Tel - +91 20 22933441/2/3 | www.isquareit.edu.in | info@isquareit.edu.in
Hope Foundation’s International Institute of Information Technology, I²IT P-14,Rajiv Gandhi Infotech Park MIDC Phase 1, Hinjawadi, Pune – 411057 Tel - +91 20 22933441/2/3 | www.isquareit.edu.in | info@isquareit.edu.in
Relationship and Rules • The Data Flow Diagram may be used for any level of data abstraction. DFD can be partitioned into levels. Each level has more information flow and data functional details than the previous level. Highest level is Context Diagram. Some important points are: • 1 process represents the entire system. • Data arrows show input and output. • Data Stores NOT shown. They are within the system. Hope Foundation’s International Institute of Information Technology, I²IT P-14,Rajiv Gandhi Infotech Park MIDC Phase 1, Hinjawadi, Pune – 411057 Tel - +91 20 22933441/2/3 | www.isquareit.edu.in | info@isquareit.edu.in
Hope Foundation’s International Institute of Information Technology, I²IT P-14,Rajiv Gandhi Infotech Park MIDC Phase 1, Hinjawadi, Pune – 411057 Tel - +91 20 22933441/2/3 | www.isquareit.edu.in | info@isquareit.edu.in
Level 0 DFD • Next Level is Level 0 DFD. Some important points are: • Level 0 DFD must balance with the context diagram it describes. • Input going into a process are different from outputs leaving the process. • Data stores are first shown at this level. Hope Foundation’s International Institute of Information Technology, I²IT P-14,Rajiv Gandhi Infotech Park MIDC Phase 1, Hinjawadi, Pune – 411057 Tel - +91 20 22933441/2/3 | www.isquareit.edu.in | info@isquareit.edu.in
Hope Foundation’s International Institute of Information Technology, I²IT P-14,Rajiv Gandhi Infotech Park MIDC Phase 1, Hinjawadi, Pune – 411057 Tel - +91 20 22933441/2/3 | www.isquareit.edu.in | info@isquareit.edu.in
Level 1 DFD • Next level is Level 1 DFD. Some important points are: • Level 1 DFD must balance with the Level 0 it describes. • Input going into a process are different from outputs leaving the process. • Continue to show data stores. Hope Foundation’s International Institute of Information Technology, I²IT P-14,Rajiv Gandhi Infotech Park MIDC Phase 1, Hinjawadi, Pune – 411057 Tel - +91 20 22933441/2/3 | www.isquareit.edu.in | info@isquareit.edu.in
From Internet Hope Foundation’s International Institute of Information Technology, I²IT P-14,Rajiv Gandhi Infotech Park MIDC Phase 1, Hinjawadi, Pune – 411057 Tel - +91 20 22933441/2/3 | www.isquareit.edu.in | info@isquareit.edu.in
Difference Between DFD & Flow Chart • A DFD may look similar to a flow chart. However, there is a significant difference with the data flow diagram. The arrows in DFDs show that there is a flow of data between the two components and not that the component is sending the data that must be executed in the following component. • A component in DFD may not continue execution when sending data and during execution of the component receiving the data. The component sending data can send multiple sets of data along several connections. In fact, a DFD node can be a component that never ends. In DFDs, all arrows must be labelled. Hope Foundation’s International Institute of Information Technology, I²IT P-14,Rajiv Gandhi Infotech Park MIDC Phase 1, Hinjawadi, Pune – 411057 Tel - +91 20 22933441/2/3 | www.isquareit.edu.in | info@isquareit.edu.in
Flow Chart Hope Foundation’s International Institute of Information Technology, I²IT P-14,Rajiv Gandhi Infotech Park MIDC Phase 1, Hinjawadi, Pune – 411057 Tel - +91 20 22933441/2/3 | www.isquareit.edu.in | info@isquareit.edu.in
Structure Chart • Structural Chart is principle tool of structure design. • Elements are , • Module • Data • Flag Hope Foundation’s International Institute of Information Technology, I²IT P-14,Rajiv Gandhi Infotech Park MIDC Phase 1, Hinjawadi, Pune – 411057 Tel - +91 20 22933441/2/3 | www.isquareit.edu.in | info@isquareit.edu.in
1. Flag going from caller to • called • 2. Data going from caller to called • 3. Data going from called to caller Hope Foundation’s International Institute of Information Technology, I²IT P-14,Rajiv Gandhi Infotech Park MIDC Phase 1, Hinjawadi, Pune – 411057 Tel - +91 20 22933441/2/3 | www.isquareit.edu.in | info@isquareit.edu.in
Design methods: Object-Oriented Design Hope Foundation’s International Institute of Information Technology, I²IT P-14,Rajiv Gandhi Infotech Park MIDC Phase 1, Hinjawadi, Pune – 411057 Tel - +91 20 22933441/2/3 | www.isquareit.edu.in | info@isquareit.edu.in
Unified Modeling Language Introduction What is UML? Hope Foundation’s International Institute of Information Technology, I²IT P-14,Rajiv Gandhi Infotech Park MIDC Phase 1, Hinjawadi, Pune – 411057 Tel - +91 20 22933441/2/3 | www.isquareit.edu.in | info@isquareit.edu.in
UML • Is Unified – remaining the same at each stage of development • Applies to Modeling – process of understanding a subject (or a system). • Is a complete Languagefor capturing knowledge (semantics) about a subject and expressing knowledge (syntax) regarding the subject for the purpose of communication Hope Foundation’s International Institute of Information Technology, I²IT P-14,Rajiv Gandhi Infotech Park MIDC Phase 1, Hinjawadi, Pune – 411057 Tel - +91 20 22933441/2/3 | www.isquareit.edu.in | info@isquareit.edu.in
Background • 1965 - The first object-oriented programming language, Simula I, was introduced • Object-oriented Analysis & Design (OOAD) by Grady Booch. • The Object Modeling Technique (OMT) by JamesRumbaugh. • The Object-oriented Software Engineering method (OOSE) by Ivar Jacobson Hope Foundation’s International Institute of Information Technology, I²IT P-14,Rajiv Gandhi Infotech Park MIDC Phase 1, Hinjawadi, Pune – 411057 Tel - +91 20 22933441/2/3 | www.isquareit.edu.in | info@isquareit.edu.in
OO Analysis vs. OO Design • Analysis refers to understanding the problem. • Design refers to coming up with the solution. REQUIREMENTS and ANALYSIS DESIGN IMPLEMENTATION TESTING Hope Foundation’s International Institute of Information Technology, I²IT P-14,Rajiv Gandhi Infotech Park MIDC Phase 1, Hinjawadi, Pune – 411057 Tel - +91 20 22933441/2/3 | www.isquareit.edu.in | info@isquareit.edu.in
OO Analysis vs. OO Design • Jacobson (OOSE) good at high-level design • Rumbaugh (OMT) good at the middle ground • Booch (OOAD) good at low-level design Hope Foundation’s International Institute of Information Technology, I²IT P-14,Rajiv Gandhi Infotech Park MIDC Phase 1, Hinjawadi, Pune – 411057 Tel - +91 20 22933441/2/3 | www.isquareit.edu.in | info@isquareit.edu.in
Relationship Among UML Diagrams • Structural Diagram • Behaviour Diagrams Hope Foundation’s International Institute of Information Technology, I²IT P-14,Rajiv Gandhi Infotech Park MIDC Phase 1, Hinjawadi, Pune – 411057 Tel - +91 20 22933441/2/3 | www.isquareit.edu.in | info@isquareit.edu.in
Static and Dynamic Modelling • Static Modelling:- Static Modelling is used to represent the static constituents of a Software such as : 1.Classes, 2.Objects, 3.Interfaces 4.Their relationship with each other. Hope Foundation’s International Institute of Information Technology, I²IT P-14,Rajiv Gandhi Infotech Park MIDC Phase 1, Hinjawadi, Pune – 411057 Tel - +91 20 22933441/2/3 | www.isquareit.edu.in | info@isquareit.edu.in
Static and Dynamic Modelling • Dynamic Modelling:- Dynamic Modelling is used to represent the behaviour of the static constituents of a software , Dynamic Modelling Represent Following Diagrams, • Interaction Diagram:- Sequence and Collaboration Diagram. • Use Case Modelling • Activity Diagram Hope Foundation’s International Institute of Information Technology, I²IT P-14,Rajiv Gandhi Infotech Park MIDC Phase 1, Hinjawadi, Pune – 411057 Tel - +91 20 22933441/2/3 | www.isquareit.edu.in | info@isquareit.edu.in
THANK YOU For further information please contact Prof. Prashant Gadakh Assistant Professor prashantg@isquareit.edu.in Department of Computer Engineering Hope Foundation’s International Institute of Information Technology, I²IT P-14, Rajiv Gandhi Infotech Park, MIDC Phase I, Hinjawadi Pune – 411 057 Phone - +91 20 22933441 www.isquareit.edu.in | info@isquareit.edu.in