Download
1 / 1
10 likes | 231 Views
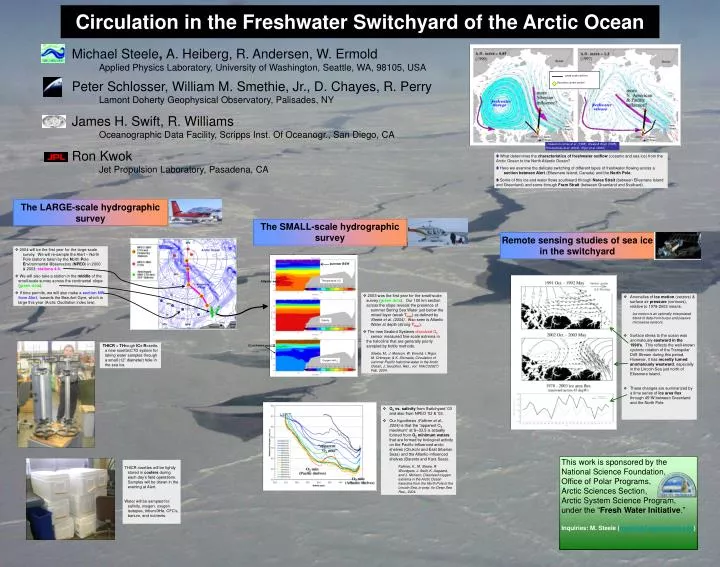
Large-scale sections. Boundary current section. Large-scale sections. Boundary current section. …based on Jones et al. (1998); Steele & Boyd (1998); Proshutinsky et al. (2002); Rigor et al. (2002). The LARGE-scale hydrographic survey. The SMALL-scale hydrographic survey.

E N D
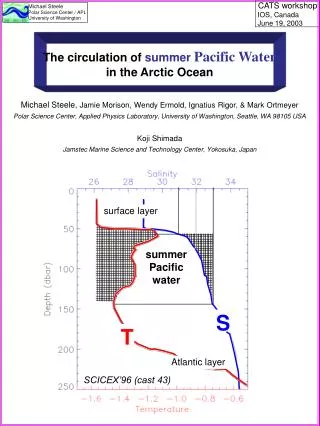
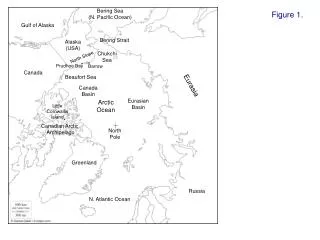
Large-scale sections Boundary current section Large-scale sections Boundary current section …based on Jones et al. (1998); Steele & Boyd (1998); Proshutinsky et al. (2002); Rigor et al. (2002) The LARGE-scale hydrographic survey The SMALL-scale hydrographic survey Circulation in the Freshwater Switchyard of the Arctic Ocean Michael Steele, A. Heiberg, R. Andersen, W. Ermold Applied Physics Laboratory, University of Washington, Seattle, WA, 98105, USA Peter Schlosser, William M. Smethie, Jr., D. Chayes, R. Perry Lamont Doherty Geophysical Observatory, Palisades, NY James H. Swift, R. Williams Oceanographic Data Facility, Scripps Inst. Of Oceanogr., San Diego, CA Ron Kwok Jet Propulsion Laboratory, Pasadena, CA • What determines the characteristics of freshwater outflow (oceanic and sea ice) from the Arctic Ocean to the North Atlantic Ocean? • Here we examine the delicate switching of different types of freshwater flowing across a section between Alert (Ellesmere Island, Canada) and the North Pole. • Some of this ice and water flows southward through Nares Strait (between Ellesmere Island and Greenland) and some through Fram Strait (between Greenland and Svalbard). Remote sensing studies of sea ice in the switchyard • 2004 will be the first year for the large-scale survey. We will re-sample the Alert – North Pole stations taken by the North Pole Environmental Observatory (NPEO) in 2000 & 2003: stations 4-8. • We will also take a station in the middle of the small-scale survey across the continental slope (green dots). • If time permits, we will also make a section NW from Alert, towards the Beaufort Gyre, which is large this year (Arctic Oscillation index low). summer BSW Temperature (°C) Atlantic water • 2003 was the first year for the small-scale survey (green dots). Our 100 km section across the slope reveals the presence of summer Bering Sea Water just below the mixed layer (weak Tmax) as defined by Steele et al. (2004). Also seen is Atlantic Water at depth (strong Tmax). • The new Seabird Systems dissolved O2 sensor measured fine-scale extrema in the halocline that are generally poorly sampled by bottle methods. Steele, M., J. Morison, W. Ermold, I. Rigor, M. Ortmeyer, & K. Shimada, Circulation of summer Pacific halocline water in the Arctic Ocean, J. Geophys. Res., vol. 109(C02027) Feb. 2004. • Anomalies of ice motion (vectors) & surface air pressure (contours), relative to 1978-2003 means. Ice motion is an optimally interpolated blend of data from buoys and passive microwave sensors. • Surface stress to the ocean was anomalously eastward in the 1990’s. This reflects the well-known cyclonic rotation of the Transpolar Drift Stream during this period. However, it has recently turned anomalously westward, especially in the Lincoln Sea just north of Ellesmere Island. • These changes are summarized by a time series of ice area flux through 45°W between Greenland and the North Pole. Salinity THICR = THrough ICe Rosette, a new rosette/CTD system for taking water samples through a small (12” diameter) hole in the sea ice. O2 extrema Oxygen (ml/L) • O2 vs. salinity from Switchyard ’03 and also from NPEO ’02 & ’03. • Our hypothesis (Falkner et al., 2004) is that the “apparent O2 maximum” at S~33.5 is actually formed from O2 minimum waters that are formed by biological activity on the Pacific-influenced arctic shelves (Chukchi and East Siberian Seas) and the Atlantic-influenced shelves (Barents and Kara Seas). Falkner, K., M. Steele, R. Woodgate, J. Swift, K. Aagaard, and J. Morison, Dissolved oxygen extrema in the Arctic Ocean halocline from the North Pole to the Lincoln Sea, in prep. for Deep Sea Res., 2004. This work is sponsored by the National Science Foundation, Office of Polar Programs, Arctic Sciences Section, Arctic System Science Program, under the “Fresh Water Initiative.” Inquiries: M. Steele (mas@apl.washington.edu) THICR rosettes will be tightly stored in coolers during each day’s field operations. Samples will be drawn in the evening at Alert. Water will be sampled for: salinity, oxygen, oxygen isotopes, tritium/3He, CFC’s, barium, and nutrients.