Download
1 / 37
520 likes | 1.75k Views
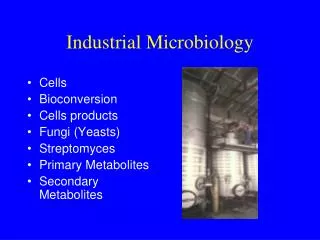
Industrial Microbiology INDM 4005 Lecture 7 18/02/04. 3. OPTIMIZATION OF FERMENTATION PROCESS. Overview Fermenter design Process optimisation- Monitor and Control. 3.1. FERMENTOR DESIGN. 3.1.1. Choice of reactor configuration depends on; (a) BIOCATALYST; Animal/ plant cells

E N D
Industrial Microbiology INDM 4005 Lecture 7 18/02/04
3. OPTIMIZATION OF FERMENTATION PROCESS • Overview • Fermenter design • Process optimisation- Monitor and Control
3.1. FERMENTOR DESIGN • 3.1.1. Choice of reactor configuration depends on; • (a) BIOCATALYST; • Animal/ plant cells • Microbial cells; • Growing • Non-growing • Enzymes; • Soluble • Immobilised
Choice of reactor configuration depends on • (b) Reactor configuration; • Batch, Semi-, Continuous, Plug-flow • Free, Immobilised • (c) Economics; • Value of product • Degree of process control • Product parameters
CASE STUDY • Draw the major types of aerobic fermenters • Draw the major types of low shear fermenters
3.1.2. DESCRIPTION OF MAJOR FERMENTOR CONFIGURATIONS • Laboratory vs Industrial scale • Batch • Continuous • Tower / loop, air-lift • Plug-flow • Immobilised • Geometry / shape • Types of aerators and agitators • Generalised difference between animal, plant and microbial cells
Why control fermentations? • Success of a fermentation depends on the maintenance of defined environmental conditions for biomass and product formation • Therefore many criteria or parameters need to be kept in control • Any deviations from optimum conditions need to be controlled and corrected by a control system
Control systems A control system consists of three basic components 1. A measuring element (senses a process property and generates a corresponding output signal) 2. A controller (compares the measurement signal with a pre-determined desired value, the set point, and produces an output signal to counteract any differences between the two 3. A final control element, which receives the control signal and adjusts the process by changing a valve opening or pump speed causing the controlled process to return to the set point
3.2. PROCESS OPTIMIZATION THROUGH MONITOR AND CONTROL • 3.2.1. KEY OBJECTIVE; • Analyse process status • Establish optimum conditions • MONITOR ; Sampling, on-, off-line, state and control variables, sensors, gate-way sensors, biosensors • MEASURE; Factors significant in sensing, measurement and display, data capture and storage • CONTROL; Key variables controlled, state and control / process variables, levels of process control, automatic control
3.2.2. MEASUREMENT - KEY PARAMETERS • ACCURACY • Ability to provide a signal related to the true value of the stimulus • RESOLUTION • Smallest change in stimulus to the sensor which causes a significant change • SENSITIVITY • Ratio of change in sensor output to the corresponding change in the stimulus • DRIFT • Variation in the output of a sensor independent of change in the stimulus
3.2.3. CONTROL SYSTEMS - general • Control system consists of 3 basic components; • 1. A measuring element (e.g. a pH probe) • 2. A controller • 3. A final control element • CAN BE; • Simple manual - control operator instructed to observe and take corrective action • Automatic - signal sent from sensor to a controller, compared with a reference value (set-point) value, signal then relayed to a valve or motor (e.g. turn-on) • IF CONTROL BASED ON; • Event has occurred == FEED BACK CONTROL • Premise that an event will occur == FEED FORWARD
3.2.4. CONTROL SYSTEMS - application AT PLANT LEVEL 1. SEQUENCING OPERATIONS; Manipulating valves, activating pumps 2. INDIVIDUAL CONTROL LOOPS; For example Temperature or pH control in reactors 3. PROCESS OPTIMIZATION; Monitoring course of a fermentation and taking corrective action.
Automatic control systems • Two position (e. g. on / off) • Proportional (effect/ action proportional to input) • Integral (effect is determined by integral of input over time i.e. area under the curve) • Derivative ( change related to rate of change of input signal i.e.slope of the curve)
Manual controlSteam valve to regulate the temperature of water flowing through a pipe EXPENSIVE Human operator instructed to control temperature within set limits Steam Valve (Final control element) Visual awareness Manual adjustment of valve Thermometer Water Pipe
Automatic controlSimple automatic control loop for temperature control Set-point Controller Steam Control Valve Measured valve Signal to operate valve Thermocouple Water Pipe
Automatic control systems Can be classified into 4 main types 1. Two-position controllers 2. Proportional controllers 3. Integral controllers 4. Derivative controllers
(1) Two position controller 100% open (on) Valve or switch position 100% closed (off) 100% open (on) Valve or switch position 100% closed (off)
(2) Proportional control 1. Output without control 2. Proportional action 3. Integral action 4. Proportional + integral action 5. Proportional + derivative action 6. Proportional + integral + derivative action 1 Positive deviation Controlled variable Set-point Negative deviation 2 4 5, 6 3 Time
Automatic control In complex control systems there are 3 different methods which are commonly used in making error corrections -proportional -integral -derivative May be used singly or in combination With electronic controllers the response to an error is represented as a change in output current or voltage
A fermenter with a temperature-controlled heating jacket Temperature controller Water outlet Thermocouple Pressure line to valve Hot water Heating Jacket Pressure regulated valve
Automatic control Proportional control the change in output of the controller is proportional to the input signal produced by the environmental change Integral control output signal of an integral controller is determined by the integral of the error input over the time of the operation Derivative control when derivative control is applied the controller senses the rate of change of the error signal and contributes a component of the output signal that is proportional to a derivative of the error signal
3.2.6. PROGRAMMABLE LOGIC CONTROLLER / CHIP (PLC) • Each has an input section, output section and a central processing unit (CPU) • Input- connect to sensors • Output - connected to motors / valves etc. • CPU - provides and executes instructions • May be linked to aManagement Information System (MIS) resulting in a database of production data. • A Laboratory Information Management System (LIMS) can also be interfaced giving all test data (e.g. info on tests carried out on all samples) • ADVANTAGE; • REPEATABILITY • TRACEABILITY
CASE STUDY Briefly outline the benefits of LIMS which contribute to sample handling (data / information handling. Any other comments on laboratory management?
3.2.7. COMPUTERS IN FERMENTATION • 3 Main areas of computer control; • LOGGING OF PROCESS DATA • Amount of data generated very great - need electronic capture • DATA ANALYSIS [Reduction of logged data] • Data reduction very significant - generates trends (e.g. graphs) • Makes analysis, management of data easier • LIMS is a good example of the benefits from this area • Predictive Modelling and Expert systems would be other examples • PROCESS CONTROL
Computer-controlled fermenter with control loop Mainframe computer Analogue to digital converter Printout Dedicated mini-computer Interface VDU Meter Analogue to digital converter Data store Graphic unit Reservoir Pump Clock Alarms Sensor
3.2.7. COMPUTERS IN FERMENTATION • PROCESS CONTROL • Digital Set-point Control (DSC) • Computer scans set-points of individual controllers and takes corrective action when deviations occur • Direct Digital Control (DDC) • Sensors interfaced directly with the computer
3.2.8. CONTROL / PROCESS VARIABLES • 1. Temperature • 2. Pressure • 3. Vessel contents • 4. Foam • 5. Impeller speed • 6. Gas Flow rates • 7. Liquid flow • 8. pH • 9. Dissolved and Gas phase Oxygen • 10. Dissolved and Gas phase Carbon Dioxide • 11. General gas analysis
Process sensors and their possible control functions Category Sensor Possible control function Physical Temperature Heat/cool Pressure Agitator shaft power RPM Foam Foam control Weight Change flow rate Flow rate Change flow rate Chemical pH Acid or alkali addition Carbon source feed rate Redox Additives to change redox potential Oxygen Change feed rate Exit-gas analysis Change feed rate Medium analysis Change in medium composition
CASE STUDY • Draw a diagram of a STR include all the major controls
3.2.9. TEMPERATURE CONTROL HEAT BALANCE IN FERMENTATION Q met = Heat ---> Microbial metabolism Q ag = " ---> Mechanical agitation Q aer = " ---> Aeration Q evap = " ---> Water evaporation Q sens = " ---> Feed streams Q exch = " ---> Exchanger / surroundings UNDER ISOTHERMAL CONDITIONS; Q met + Q ag + Q aer = Q evap + Q sens + Q exch
CASE STUDY • Draw a flow sheet of the heat balance in a typical fermentation • List the methods of measuring temperature (chapter 8) • Outline methods of temperature control
3.3. FERMENTATION MEASUREMENT /monitoring; PHYSICAL (e.g Temperature, Pressure etc.) CHEMICAL ( e.g. pH, Redox, Ions etc.) INTRACELLULAR ( Cell mass composition, enzyme levels etc.) BIOLOGICAL ( e.g. Morphology, cell size, viable count etc.)
CASE STUDY Report on the methods used to estimate biomass within a reactor - give advantages / disadvantages of each
TYPICAL PARAMETERS - Penicillin fermentation • (1) Feeding rate of substrate / precursor • (2) Biomass conc. per litre and per fermenter (mass) • (3) Penicillin conc. and mass • (4) Growth rate • (5) Fraction of glucose --> Mass • Maintenance • Product • (6) Respiration rate • (7) Oxygen demand • (8) Total broth weight • (9) Cumulative efficiency • (10) Elemental balance of P, N, S
Models • Series of equations used to correlate data and predict behavior. • Based on known relationships • Cyclical nature of models, involves formulation of a hypothesis, then experimental design followed by experiments and analysis of results which should further advance the original hypothesis • Conceptual, Empirical, and Mechanistic models
Summary • Why fermentations need to controlled • How to control fementations • Use of computers in control of bioprocesses • Difference between manual and automatic control systems • Process variables that need controlling