Download
1 / 2
20 likes | 144 Views
FXDatapanel is the first and only Forex Trading Signals Platform. It is the product of renowned Financial Technology (Fintech) Company Finscientist. Fxdatapanel provides high-quality trade signal services to retail traders, financial advisors, institutional traders, and Forex Brokers. Trade signals have gained massive popularity in recent times. Forex Traders use the signals to reduce the burden of manually evaluating the Forex market for trading opportunities. The signal service is popular with both novice and expert traders, and it brings the opportunity to profit from the financial market.

E N D
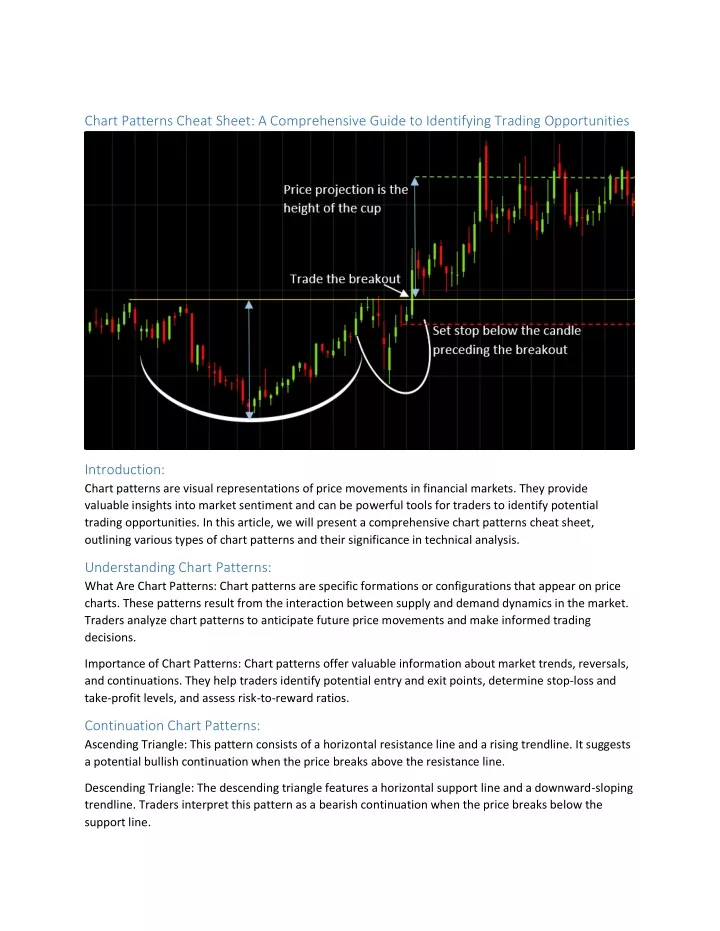
Chart Patterns Cheat Sheet: A Comprehensive Guide to Identifying Trading Opportunities Introduction: Chart patterns are visual representations of price movements in financial markets. They provide valuable insights into market sentiment and can be powerful tools for traders to identify potential trading opportunities. In this article, we will present a comprehensive chart patterns cheat sheet, outlining various types of chart patterns and their significance in technical analysis. Understanding Chart Patterns: What Are Chart Patterns: Chart patterns are specific formations or configurations that appear on price charts. These patterns result from the interaction between supply and demand dynamics in the market. Traders analyze chart patterns to anticipate future price movements and make informed trading decisions. Importance of Chart Patterns: Chart patterns offer valuable information about market trends, reversals, and continuations. They help traders identify potential entry and exit points, determine stop-loss and take-profit levels, and assess risk-to-reward ratios. Continuation Chart Patterns: Ascending Triangle: This pattern consists of a horizontal resistance line and a rising trendline. It suggests a potential bullish continuation when the price breaks above the resistance line. Descending Triangle: The descending triangle features a horizontal support line and a downward-sloping trendline. Traders interpret this pattern as a bearish continuation when the price breaks below the support line.
Symmetrical Triangle: The symmetrical triangle displays converging trendlines, indicating a period of consolidation. Traders anticipate a potential continuation in the direction of the preceding trend when the price breaks out of the pattern. Reversal Chart Patterns: Head and Shoulders: This pattern comprises a central peak (head) flanked by two smaller peaks (shoulders). It suggests a reversal from bullish to bearish when the price breaks below the neckline, which connects the lows of the pattern. Inverse Head and Shoulders: The inverse head and shoulders pattern is the mirror image of the regular head and shoulders. It indicates a reversal from bearish to bullish when the price breaks above the neckline. Double Top/Bottom: A double top pattern forms when the price reaches a high, retraces, and then makes a second failed attempt to break the previous high. Conversely, a double bottom pattern occurs when the price reaches a low, retraces, and then forms a second failed attempt to break the previous low. Traders interpret these patterns as potential reversals. Consolidation Chart Patterns: Rectangle: The rectangle pattern consists of parallel support and resistance levels, creating a rectangular shape. Traders anticipate a potential breakout when the price moves above the resistance or below the support level. Pennant: The pennant pattern resembles a small symmetrical triangle and signifies a brief pause in a strong trend. Traders expect a continuation of the previous trend when the price breaks out of the pattern. Flag: Similar to the pennant, the flag pattern is a small rectangular-shaped consolidation after a strong price move. Traders anticipate a continuation of the previous trend when the price breaks out of the flag pattern. Conclusion: Chart patterns provide traders with valuable insights into market dynamics and can significantly enhance their decision-making process. This chart patterns cheat sheet serves as a comprehensive guide, highlighting the key features and significance of various chart patterns. By studying and recognizing these patterns on price charts, traders can identify potential trading opportunities, determine entry and exit points, and effectively manage risk. However, it is important to remember that chart patterns are not foolproof indicators and should be used in conjunction with other technical analysis tools and risk management strategies. With practice and experience, traders can leverage the power of chart patterns to improve their trading performance in the dynamic world of financial markets.