Download
1 / 29
290 likes | 813 Views
Low carbon city: win-win strategy for global climate change and regional air pollution 低碳城市:全球 气候变化和区域空气污染双赢战略. Ding Yihui (丁一汇) National Climate Center (国家气候中心) China Meteorological Administration (中国气象局).

E N D
Low carbon city: win-win strategy for global climate change and regional air pollution 低碳城市:全球气候变化和区域空气污染双赢战略 Ding Yihui(丁一汇) National Climate Center(国家气候中心) China Meteorological Administration(中国气象局)
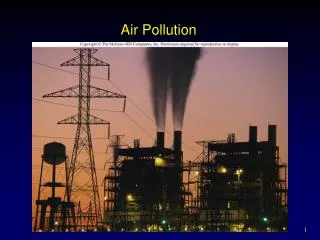
Atmospheric aerosols and their roles in air pollution and climate change (大气气溶胶及其在空气污染和气候变化中的作用) • What is the atmospheric aerosols? Atmospheric aerosols are a complex chemical mixture of solid and liquid mixture of particles suspended in air. Their sizes range from the smallest superfine mode, with diameters of a few nanometers, to large coase mode particles, with diameters of a few micrometers or more. Between the superfine and coase mode particles are the fine mode particles, with diameters ranging from 0.1μm to a few micrometers. So, the typical size of atmospheric aerosols ranges between 0.001 and 10 μm that reside in the atmosphere for several days and weeks.
Source regions and long-distance transport of atmospheric aerosols, leading to extensive areas of air pollution. The atmospheric aerosols may be emitted as particles (primary sources) or formed in the atmosphere from gaseous precursors (secondary sources). They have two sources: natural and anthropogenic, as shown in the following table:
Effects of atmospheric aerosols on climatic system (or climatic parameters). Atmospheric aerosol particles can influence climate change with altering radiative transfer through the atmosphere and the atmospheric water cycle. For the influence of aerosols on climate, the best easily understood mechanism is by directly scattering and absorbing incoming solar radiation and long-wave radiation, thus altering the radiative balance of the earth-atmosphere system. This effect is defined as the direct effect of the atmospheric aerosols. For example scattering incoming solar radiation by sulphate may aerosols increase the Earth’s albedo, thereby cooling the atmosphere and the surface; absorption of solar radiation by soot (black carbon) may cool the surface while heating the atmosphere. Direct aerosol effect is primarily a short-wave forcing process and the absorbtion of the long-wave radiation is believed to be small for anthropogenic aerosols other than soot.
Impact of aerosols on the water cycle The atmospheric aerosols can affect the water cycle, as an integral part of the atmospheric hydrodogical cycle, through roles of aerosols in cloud microphysical processes, as aerosol particles act as cloud condensation nuclei (CCN) and ice nuclei (IN). Through this mechanism, which is called “indirect effect”, the aerosols may modify the microphysical and hence the radiative properties, amount and lifetime of clouds. Key parameters for determing the indirect effect are the effectiveness of an aerosol particle to act as a cloud condensation nucleus. The microphysically induced effect on cloud droplet number concertation and hence the cloud droplet size, with the liquid water content fixed has been called “the first indirect effect” or “the cloud albed effect”.
The microphysically induced effect on the liquid water content, cloud height, and lifetime of clouds has been called the “second indirect effect” or “cloud lifetime effect”. The cloud albedo effect mainly causes cooling effect and precipitation decrease while the cloud lifetime effect has nearly same effect as the cloud albedo effect. Additionally, there are the semi-indirect effect and the glaciation effect. The former refers to the absorbtion of solar radiation by soot, re-emitted as thermal radiation, hence heating the air mass and increasy static stability relative to the surface. It may also cause evaporation of cloud droplets and decrease of precipitation.
Impacts of the atmospheric aerosols on air pollution and climate change. In contrast to greenhouse gases, most of which are long-lived, atmospheric aerosol particles are short-lived in the troposphere with lifetimes of around a week. The short lifetimes, together with the highly non-uniform geographyical distribution of aerosol sources, results in a highly non-uniform geographical distribution in very different patterns of radiative forcing and may result in different air pollution and climate response patterns compared with greenhouse gases which are will-mixed.
By increasing aerosol and cloud optical depth, anthropogenic emission of aerosols and their precusors contribute to a reduction of solar rediation at the surface (global dimming). As such, worsening air quality especially as the phenomenon of regional haze contributes to regional aerosol effects. The significant consequences are significant reduction in visibility and sunshine duration. In South Asia, absorbing aerosols may have masked up to 50% of the surface warming due to the global increase in greenhouse gases.
The climate effect of aerosols and comparison with principal greenhouse gases.
Components of RF for emissions of principal gases, aerosols and aerosol precursors and other changes. Values represent RF in 2005 due to emissions and changes since 1750. (S) and (T) next to gas species represent stratospheric and tropospheric changes, respectively. IPCC, 2007
(A) Global mean RFs from the agents and mechanisms discussed in this chapter, grouped by agent type. Anthropogenic RFs and the natural direct solar RF are shown. The plotted RF values correspond to the bold values in Table 2.12. Columns indicate other characteristics of the RF; effi cacies are not used to modify the RFs shown. Time scales represent the length of time that a given RF term would persist in the atmosphere after the associated emissions and changes ceased. No CO2 time scale is given, as its removal from the atmosphere involves a range of processes that can span long time scales, and thus cannot be expressed accurately with a narrow range of lifetime values. The scientifi c understanding shown for each term is described in. (B) Probability distribution functions (PDFs) from combining anthropogenic RFs in (A). Three cases are shown: the total of all anthropogenic RF terms (block fi lled red curve); LLGHGs and ozone RFs only (dashed red curve); and aerosol direct and cloud albedo RFs only (dashed blue curve). Surface albedo, contrails and stratospheric water vapour RFs are included in the total curve but not in the others. For all of the contributing forcing agents, the uncertainty is assumed to be represented by a normal distribution (and 90% confi dence intervals) with the following exceptions: contrails, for which a lognormal distribution is assumed to account for the fact that the uncertainty is quoted as a factor of three; and tropospheric ozone, the direct aerosol RF (sulphate, fossil fuel organic and black carbon, biomass burning aerosols) and the cloud albedo RF, for which discrete values are randomly sampled. IPCC, 2007
In summary, an increase in atmospheric aerosol load decreases air quality and reduces the amount of solar radiation reaching the surface. This negative rediative forcing competes with greenhouse gas warming for determing the change in the surface temperature, precipitation and evaporation. Therefore, air quality and climate change cannot be considered in isolation. They are intimately coupled. The hypothetical removal from the atmosphere of the entire burden of anthropogenic sulphate aerosols particles (in an effort to improve air quality) would produce a rather immediate increase of about 0.8℃ in the globally averaged temperature with geographical patterns that bear a resemblance to the temperature change found in greenhouse gas scenario experiments. Thus, environmental strategies aimed at maintaining “global warming” below a prescribed threshold must therefore account not only for CO2 emissions, but also for measures implemented to improve air quality.
Sulfate aerosols cooling effect for surface temperature Red curve: without aerosols starting from 2000; Blue curve: with aerosols
Total dry aerosol mass (μg/m3) of sulfate, nitrate, ammonium, black carbon (BC), primary organic aerosols (POA) and secondary organic aerosols (SOA) in the surface layer from the baseline simulations for present-day (top) and year 2100 (bottom) for IPCC SRES scenario A2 (Source: Liao and Seinfeld 2005). The global mixing ratios are shown on the top corner of each panel. Ranjeet,2008
Atmospheric CO2 and methane concentrations have increased 中国气象局—瓦里关全球大气本底站 大气CO2浓度测量结果 Baseline station at Waliguan, West China CO2浓度2006年已高达384.65ppmv。年增长率1.77ppmv (CAMS/CMA)
瓦里关和Manna Loa的甲烷测量比较 2006年CH4浓度 上线:瓦里关:1861.06ppb,年增长率:4.25ppb/yr。 下线:Mauna Loa:1809.05ppb,年增长率:3.74ppb/yr。 (CAMS/CMA)
青海瓦里关地区大气黑碳气溶胶(Black carbon)的增加 国家气候变化评估报告,2005
44 stations including Beijing: AOD annual variations 北京等44站平均大气气溶胶光学厚度的年变化 气候变化科学概论,2007
PH value: Acid rain variations in North China 北方7省市年平均降水PH值、酸雨和强酸雨频率历年变化 国家气候中心
能见度(公里) 2004年全国阴霾日数的分布 相 对 湿 度 (%) Long-term variation of hazy days in China全国霾天气的变化 霾是指大量极细微的干尘粒浮游在空中,使水平能见度小于10公里、空气普遍混浊的天气现象。 霾已经成为我国工业化阶段频次增长最快的灾害性天气,其影响已不亚于沙尘暴天气,威胁交通、电力安全和人体健康。 国家气候中心
Long-term variation of hazy days in Shenzhen 深圳年灰霾日数变化 深圳市气象局
Long-term variation of atmospheric visibility in Shenzhen 深圳年平均能见度变化图 深圳市气象局
Coordinated strategy for addressing air pollution and climate change(应对空气污染和气候变化的协同对策) • Climate change and air pollution have to a large extent, a common cause: emissions from fossil fuel burning. • Air pollution can influence climate change while climate change can also impact air quality and exacerbate the impacts of air pollution on human health, agricultural production and ecosystem. Such coupled connections imply the need for increased integration in the understanding of air quality and climate change common issues in order to develop the appropriate synergistic abatement strategies, thus leading to win-win scenarios in relation to abatement options for both areas.
Monitoring strategies for air pollution and climate change observation systems shoud be developed in a harmonized manner to ensure comparable database of key common issue measurements.
A multi-scale coupled (global, regional, cloud and air pollution models) prediction system should be developed and put into operational use for control actions. Xu et al.,2007