Download
1 / 23
230 likes | 336 Views
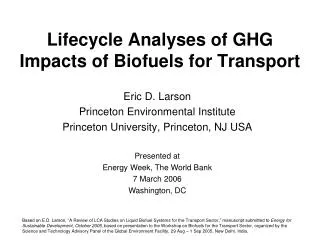
Lifecycle Analyses of GHG Impacts of Biofuels for Transport. Eric D. Larson Princeton Environmental Institute Princeton University, Princeton, NJ USA. Presented at Energy Week, The World Bank 7 March 2006 Washington, DC.

E N D
Lifecycle Analyses of GHG Impacts of Biofuels for Transport Eric D. Larson Princeton Environmental Institute Princeton University, Princeton, NJ USA Presented at Energy Week, The World Bank 7 March 2006 Washington, DC Based on E.D. Larson, “A Review of LCA Studies on Liquid Biofuel Systems for the Transport Sector,” manuscript submitted to Energy for Sustainable Development, October 2005, based on presentation to the Workshop on Biofuels for the Transport Sector, organized by the Science and Technology Advisory Panel of the Global Environment Facility, 29 Aug – 1 Sep 2005, New Delhi, India.
Content of this talk • Striking features of different LCA results. • Key variables/uncertainties in LCA results. • GHG impacts of biomass use for transportation vs. stationary applications
Striking features of LCA studies reviewed • Wide range of biofuels have been included in different LCAs: • Biodiesel (fatty acid methyl ester, FAME, or fatty acid ethyl ester, FAEE) • rapeseed (RME), soybeans (SME), sunflowers, coconuts, recycled cooking oil • Pure plant oil • rapeseed • Bioethanol (E100, E85, E10, ETBE) • grains or seeds: corn, wheat, potato • sugar crops: sugar beets, sugarcane • lignocellulosic biomass: wheat straw, switchgrass, short rotation woody crops • Fischer-Tropsch diesel and Dimethyl ether (DME) • lignocellulosic waste wood, short-rotation woody crops (poplar, willow), switchgrass • LCAs are almost universally set in European or North American context (crops, soil types, agronomic practices, etc.). One prominent exception is an excellent Brazil sugarcane ethanol LCA. • Extremely wide range reported for LCA results for GHG mitigation • Across different biofuels • Across different LCA studies for same biofuel • Lack of focus on evaluating per-hectare GHG impacts. • Most analyses report GHG savings per GJ biofuel. • Some report GHG savings per-vkm. • Few focus on understanding what approaches maximize land-use efficiency for GHG mitigation • All studies are relatively narrow engineering analyses that assume one set of activities replaces another.
16% GHG savings per v-km 63% GHG savings per v-km Wide range in LCA results (1) Concawe, et al., 2004.
Wide range in LCA results (2) Quirin, et al., 2004.
Key Variables in LCA Studies • Allocation of co-product credits • Nitrous oxide (N2O) emissions • Soil carbon sequestration
Different co-product allocation methods have different pros and cons • No allocation. • Allocation by co-product weight. • Allocation by co-product energy content. • Allocation by share of process energy consumed to make co-product. • Allocation by co-product market value. • Allocation by energy displaced by substituting co-product for conventional (fossil-fuel derived) product. • Choice of allocation method depends on context – no intrinsically right method.
Different allocation methods can give widely varying results Percent savings in lifecycle GHG emissions for corn ethanol production using different co-product allocation methods: Wang et al. 2005.
N2O can be large contributor to total GHG emissions due to high GWP (~300xCO2) Mid-range of values reported by Elsayed et al., 2003.
Direct N2O from annual crops, Germany N2O from short-rotation willow, NE USA GM, et al. 2002 (European study). N2O emissions depend on type of crop (e.g., annual vs. perennial), agronomic practices, climate, and soil type. Heller, et al. 2003.
Soil carbon storage depends on soil type and prior land use • Soil carbon will eventually saturate. • Re-release possible. • Most LCA studies assume no soil carbon contribution (+ or -) to GHG emissions. McLaughlin, et al, 2002.
Most studies focus on GHG emissions per GJ biofuel or per v-km. Emissions per ha/yr may give different ranking. Elsayed, et al. 2003.
However, little disagreement that grain biofuels give less energy services (and more GHG emissions) per ha/yr than lignocellulosic crops – due primarily to lower effective yield per ha. IPCC, 1996.
Biomass yield is a key parameter – depends on crop, agronomic practices, soil type, topography, climate... IPCC, 1996.
Potential for higher yields with lower inputs for lignocellulosic crops offer larger future GHG mitigation potential than grains/sugars
GHG mitigation for bio-electricity vs. biofuel depends primarily on: • What biofuel is being produced. • How the biofuel is being made (conversion technology). • Fossil fuel systems being displaced. Higher biomass yields (10 t/ha/yr); Diesel-cycle engine. Lower biomass yields; Otto-cycle engine. CONCAWE et al. 2004.
Wrap up • Broad range of LCA results for GHG mitigation for any given biofuel due to different input assumptions (corresponding to different actual practices) and methods. • But, some broad conclusions are possible • Grain-based biofuels offer less GHG mitigation than lignocellulosic-based fuels due primarily to lower effective yields. • Among commercial biofuels today, sugarcane ethanol gives highest land use efficiency for GHG mitigation. • In longer term, land use efficiency for GHG mitigation is likely to be highest for lignocellulosic plantation biomass (FT or DME in 2010/2015 timeframe, ethanol in 2020/2030 time frame) • Biomass for biofuels vs. biomass for electricity • Less GHG mitigation per hectare if biomass is used to make biofuels than if it is used to make electricity displacing coal power. (This is true with existing steam cycle biopower technology and more true with future bio-IGCC.) • If bio-electricity is displacing NGCC electricity or electricity from any fossil-fuel combined heat and power, then biofuels (from sugarcane or from lignocellulosic crops) may give greater GHG mitigation per hectare. • Cost of GHG mitigation ($/tCavoided) for stationary versus transport applications has not been examined, but likely would be lower for higher GHG mitigation options.
Biofuels Brazil sugarcane, best practice 2002 Corn ethanol, 2005 HHV efficiency ~ 36% ~ 43% ~ 76% FCP ~ 54% Biomass steam cycle, 25% efficiency Avoided GHG emissions for biofuels vs. conventional bio-electricity Ethanol and FT fuels from lignocellulosic biomass in USA (with foreseeable RD&D advances in switchgrass production and conversion). (US corn EtOH and Brazil sugarcane EtOH also shown.) Electricity from conventional biomass steam cycle (25% swg to electricity HHV).
Potential to increase yields of lignocellulosic crops is substantial (unlike potential for grains/sugar yields) Historical corn yields in USA Greene, 2004.
Biofuels Brazil sugarcane, best practice 2002 Corn ethanol, 2005 HHV efficiency ~ 36% ~ 43% ~ 54% ~ 76% FCP Biomass IGCC, 45% efficiency Avoided GHG emissions for biofuels vs. IGCC bio-electricity Ethanol and FT fuels from lignocellulosic biomass in USA (with foreseeable RD&D advances in switchgrass production and conversion). (US corn EtOH and Brazil sugarcane EtOH also shown.) Electricity from biomass-IGCC with foreseeable RD&D advances (by ~2015) in switchgrass production and conversion (45% swg to electricity HHV).
Grains produce unused residues, which if used for process energy (e.g., as with sugarcane ethanol), would improve GHG performance (but not vkm/ha)..