Download
1 / 29
300 likes | 788 Views
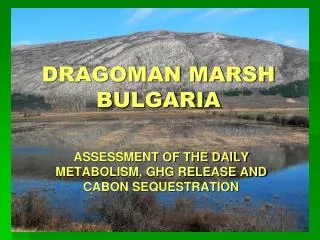
DRAGOMAN MARSH BULGARIA ASSESSMENT OF THE DAILY METABOLISM, GHG RELEASE AND CABON SEQUESTRATION Andrey Ralev , BALKANI Wildlife Society Ivan Traykov , Department of Ecology and EP, Sofia University Balkani Wildlife Society Created 1989, registered 1992. 70 members and 10 employees.

E N D
DRAGOMAN MARSHBULGARIA ASSESSMENT OF THE DAILY METABOLISM, GHG RELEASE AND CABON SEQUESTRATION
AndreyRalev, BALKANI Wildlife Society Ivan Traykov, Department of Ecology and EP, Sofia University
Balkani Wildlife Society Created 1989, registered 1992. 70 members and 10 employees. 1. Research, conservation and restoration of biodiversity. 2. Development of nature protection legislation. 3. Rising public awareness. www.balkani.org
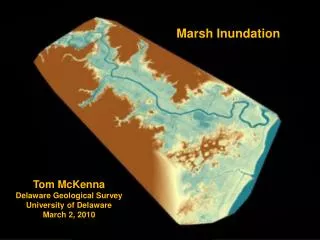
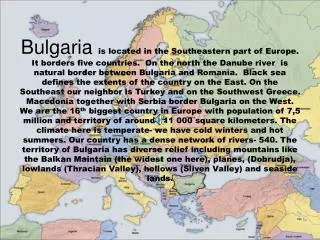
Dragoman Marsh • 331 ha, 705 m.a.s.l., 40 km from Sofia • The biggest karst marsh • Drained 1930s-1950s • Restoration since end of the 1990s
Dragoman Marsh - now • 226 species of birds, 126 breeding • 30-40 pairs Ferruginous Duck (Aythianyroca) • 2006: Great White Egret, Purple Heron, Gray Heron, Great Bittern, Little Bittern
Chepan Hill (1206 m) • Unique steppic submediteranean flora • Endemic plants: E. serbicus, A. wilmottianus,T. urumoffii
Wet meadows • Specific boreal flora: Salix rosmarinifolia, Plantago maxima, Viola pumila, Fritilaria meleagroides • 30-50 pairs of Corncrake (Crex crex)
Work in the region 1. Monitoring of birds (since 1994) 2. Environmental education
Work in the region 3. Purchase of land in the Marsh (43 ha)
Work in the region 4. Visitors infrastructure:
Wetland Conservation Centre
Work in the region 5. Programme for wastewater treatment:
Constructed Wetlands Pond System Creates work for local people (building and keeping) Needs less energy and expertise for keeping Needs more space (~10 sqm/inh. = 3-4 ha total for 3500 inh.)
Work in the region 6. Protection and restoration of species:
Work in the region 7. Using biomass from the marsh as energy:
Carbon sequestration Ivan Traykov, AneliaKenarova Department of Ecology and EP, Sofia Ubiversity Anita Tosheva Department of Botany, Sofia University
Production of the marsh • Vegetation type/ habitat maps • Above ground biomass assessment (emergent and submergent vegetation) • Phytoplankton production (light and dark bottles, chlorophyll-a) • Community metabolism (diurnal oxygen changes) • GHG ebullition rates (CH4 and CO2)
Phytoplankton production • GPP = 3,45 gC/m2/d • CR = 3,46 gC/m2/d • P/R = 0,99
Phytoplankton production The measured NPP in the draining canals corresponds to Chl-a content in the phytoplankton of 39.8 ± 11.7 mg/m3, while in the inner open water pools the Chl-a is 5.33 ± 1.4 mg/m3 . Vassilev and Tsavkova (2004) have shown strict relationship between the two studied parameters in Srebarna marsh. If we accept it to be true for Dragoman marsh as well, than the NPP of phytoplankton in the inner basins would be 0.08 gO2/m3/h, which is just 5.8% of the СМ (1.38 ±0.33 gO2/m3/h) in this type of habitats. The area of the open water habitat in the marsh is117 ha, from which the draining canals take just 1%. The NPP of the inner pools is assessed to be 44.2 tC/yand that of the drainage canals - 5.5 tC/y
Community metabolism NPPmax = 2,85 gO2/m3/h at 0,3m depth between 2 and 4 pm
GHG ebullition rates CH4 ebullition ca. 95 295 kg/y', i.e., 287 kg/ha/y. Annual CH4 emition up to ca. 633 kg/ha/y. comparable to the 701 kg/ha/y found by Kankaala et al., (2004) for total annual emission of methane from the littoral zone of shallow lakes. CO2 ebullition is ca. 5 070 kg/y', i.e., 15.3 kg/ha/y.
Future actions: • More detailed study of CO2 sequestration • Dragoman Marsh management plan – habitat for endangered species • Waste water treatment plant of Dragoman town – constructed wetland • Using biomass from the marsh as energy source • Preventing the common practice of burning the organic remains on agricultural lands