Download
1 / 48
480 likes | 1.02k Views
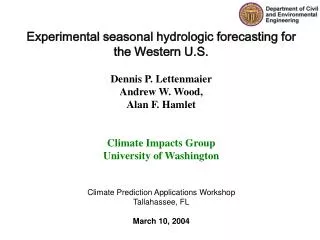
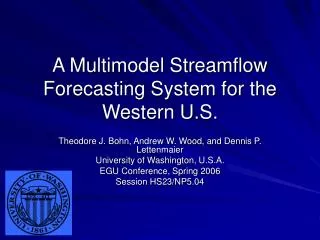
An experimental seasonal hydrologic forecast system for the western U.S. Dennis P. Lettenmaier Department of Civil and Environmental Engineering University of Washington for Cincinnati Earth Systems Science Seminar Series and Advanced Environmental Seminar Series

E N D
An experimental seasonal hydrologic forecast system for the western U.S. Dennis P. Lettenmaier Department of Civil and Environmental Engineering University of Washington for Cincinnati Earth Systems Science Seminar Series and Advanced Environmental Seminar Series University of Cincinatti Apr 30, 2004
Outline of this talk • Introduction: seasonal hydrologic forecasting historical development; current operational methods • Modeling framework and implementation for long-lead seasonal streamflow forecasting • Estimating the hydrologic initial conditions • Approaches based on ensemble climate prediction • Data assimilation – example using the MODIS snow cover product • Westwide streamflow forecast system – experience in winters 2002-3 and 2003-4 • Conclusions and unsolved problems
Introduction: seasonal hydrologic forecasting historical development
Reservoir Storage Aug Dec Apr Aug Introduction: Seasonal Hydrologic Forecasts water management hydropower irrigation flood control water supply fisheries recreation navigation water quality
Introduction:Hydrologic prediction – long history Snow water content on April 1 • should add my personal pics of - • snow sampling • snotel sites • (and scan in curve method figure) NRCS SNOTEL Network SNOTEL network McLean, D.A., 1948 Western Snow Conf. April to August runoff
recently observed meteorological data ensemble of met. data to generate forecast ESP forecast Spin-up ICs Forecast obs hydrologic state RMSE Introduction:Hydrologic prediction and NWS • NWS River Forecast Center (RFC) • approach: rainfall-runoff modeling • (i.e., NWS River Forecast System, • Anderson, 1973 • offspring of Stanford Watershed Model, Crawford & Linsley, 1966) • Ensemble Streamflow Prediction (ESP) • used for shorter lead predictions; • ~ used for longer lead predictions • The RFC final seasonal • forecasts also incorporate • NRCS results. Neither NWS or NRCS objectively use contemporary climate forecasts
Introduction:Current Operational Methods A primary seasonal forecasting product is the runoff volume forecast UPPER COLUMBIA BASINS Mar-04MIDMN W A T E R S U P P L Y F O R E C A S T S FORECAST RUNOFF AVERAGE RO PREV STREAM AND STATION PERIOD PROBABLE % MAXIMUM % MINIMUM % RUNOFF PERIOD COLUMBIA RIVER MICA RESERVOIR INFLOW, BC JAN-JUL 9100.0 95 10400.0 108 7770.0 81 9619. 1049 FEB-SEP 12200.0 94 13600.0 105 10900.0 84 12960. 13000 APR-SEP 11800.0 94 13200.0 106 10500.0 84 12500. 12590 REVELSTOKE, BC JAN-JUL 13200.0 95 14400.0 104 12100.0 87 13880. 15070 ARROW LAKES INFLOW JAN-JUL 19300.0 92 21300.0 102 17200.0 82 20960. 21970 FEB-SEP 24400.0 92 26500.0 100 22300.0 84 26460. 26070 APR-SEP 23100.0 92 25100.0 100 21000.0 84 25110. 24950 BIRCHBANK, BC (1) JAN-JUL 34900.0 90 40100.0 103 29600.0 76 38930. 42950 APR-SEP 39000.0 90 44200.0 102 33700.0 77 43500. 46150 GRAND COULEE, WA (1) JAN-JUL 55500.0 88 64000.0 102 46900.0 75 62900. 68020 APR-SEP 56400.0 88 65000.0 102 47900.0 75 63990. 68220 ROCK ISLAND DAM BLO, WA (1) JAN-JUL 61000.0 89 70400.0 102 51600.0 75 68910. 74830 APR-SEP 61500.0 88 71000.0 102 52100.0 75 69540. 74300 THE DALLES NR, OR (1) JAN-JUL 92000.0 86 106000.0 99 78400.0 73 107300. 103800 APR-AUG 79800.0 86 93400.0 100 66200.0 71 93090. 93800 APR-SEP 84600.0 86 98200.0 100 71000.0 72 98650. 98080
Introduction: Research Rationale Are current seasonal hydrologic forecasts all that they can be? How can ongoing research on land-atmosphere interactions help to improve seasonal streamflow forecasts in the western U.S.? • Potential sources of improvement since inception of regression/ESP methods: • operational seasonal climate forecasts (model-based and otherwise) • greater availability of station data • computing • new satellite-based products (primarily snow cover) • distributed, physical hydrologic modeling for macroscale regions
ESP forecast “Reverse-ESP” forecast ensemble of met data to generate ensemble of ICs perfect retrospective met forecast recently observed meteorological data ensemble of met. data to generate forecast Spin-up ICs Forecast Spin-up ICs Forecast obs “obs” = perfect spinup + perfect fcst simulation hydrologic state obs RMSE hydrologic state Analysis performed over 21-year period (1979-99), from which spinup and fcst traces were taken. RMSE Estimating relative impact of initial conditions and forecast accuracy Retrospective ESP-type simulations can shed light on the relative value of initial conditions to a given forecast application.
Initial Conditions:Balancing IC and forecast accuracy Columbia R. Basin fcst more impt ICs more impt Rio Grande R. Basin RMSE (perfect IC, uncertain fcst) RMSE (perfect fcst, uncertain IC) RE =
Initial Conditions: Hydrologic Simulations start of month 0 end of mon 6-12 1-2 years back forecast ensemble(s) model spin-up initial conditions climatology ensemble NCDC met. station obs. up to 2-4 months from current 2000-3000 stations in west LDAS/other real-time met. forcings for remaining spin-up ~300-400 stations in west climate forecast information data sources Forecast Products streamflow soil moisture runoff snowpack derived products e.g., reservoir system forecasts obs snow state information (eg, SNOTEL)
Initial Conditions:estimating run-up conditions Problem: met. data availability in 3 months prior to forecast has only a tenth of long term stations used to calibrate model Solution: use interpolated monthly index station precip percentiles and temperature anomalies to extract values from higher quality retrospective forcing data -- then disaggregate using daily index station signal. sparse station network in real-time dense station network for model calibration
Initial Conditions: snow state assimilation Problem sparse station spin-up period incurs some systematic errors, but snow state estimation is critical Solution use SWE anomaly observations (from the 600+ station USDA/NRCS SNOTEL network and a dozen ASP stations in BC, Canada) to adjust snow state at the forecast start date
spatial weighting function elevation weighting function SNOTEL/ASP VIC cell Initial Conditions: Initial snow state assimilation • Assimilation Method • weight station OBS’ influence over VIC cell based on distance and elevation difference • number of stations influencing a given cell depends on specified influence distances • distances “fit”: OBS weighting increased throughout season • OBS anomalies applied to VIC long term means, combined with VIC-simulated SWE • adjustment specific to each VIC snow band
Initial Conditions: Snow state assimilation SWE state differences due to assimilation of SNOTEL/ASP observations, Feb. 25, 2004
Initial Conditions:final product Snow Water Equivalent (SWE) and Soil Moisture
MODIS Update Description and Products of MODIS Updated Forecasts local scale weather inputs Initial Conditions: soil moisture, snowpack Hydrologic model spin up Hydrologic simulation Ensemble Forecast: streamflow, soil moisture, snowpack, runoff NCDC met. station obs. up to 2-4 months from current LDAS/other real-time met. forcings for remaining spin-up End of Month 6 - 12 1-2 years back 25th Day of Month 0 Change in Snowcover as a Result of MODIS Update for April 1, 2004 Forecast Snowcover before MODIS update Snowcover after MODIS update
Result of MODIS Update on Streamflow and Storage April 1, 2004 Forecast Unadjusted MODIS Unadjusted MODIS Adjusted
Unadjusted vs adjusted forecast errors, 2001-2003, for reservoir inflow volumes (left plot) and reservoir storage (right)
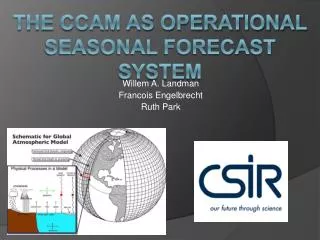
Climate Forecasts:Seasonal prediction • Climate prediction has markedly advanced in the last several decades • better monitoring of oceans and atmosphere • deeper understanding of ocean-atmosphere teleconnections • Monthly / seasonal climate forecasting has become operational at a number of research centers Circulation Features Sea Surface Temps Typical climate model spatial resolution e.g El Nino / La Nina
hydrologic model inputs streamflow, soil moisture, snowpack, runoff, derived products • climate forecast • ~2-3 degree resolution (T42-T62) • monthly total P, avg T • Use 2 step approach:1) statistical bias correction • 2) downscaling 1. climate model ensemble outputs • 1/8-1/4 degree resolution • daily P, Tmin, Tmax 2. Extended (“Ensemble) Streamflow Prediction (ESP) • 1/8-1/4 degree resolution • daily P, Tmin, Tmax • No bias-correction or downscaling needed • Met. traces can be composited before/after ensemble is run to represent ENSO, PDO conditions, etc. Overview: Hydrologic Forecast Approach
Overview: Global Spectral Model (GSM) ensemble forecasts from NCEP/EMC • forecast ensembles available near beginning of each month, extend 6 months beginning in following month • each month: • 210 ensemble members define GSM climatology for monthly Ptot & Tavg • 20 ensemble members define GSM forecast
TOBS a. b. c. TGSM Overview: climate model forecast processing sequence a) bias correction: climate model climatology observed climatology b) spatial interpolation: e.g., GSM (1.8-1.9 deg.) VIC (1/8 deg) c) temporal disaggregation (via resampling of observed patterns): monthly daily
specific to calendar month and climate model grid cell Climate Forecasts: Bias Correction • numerous methods of downscaling and/or bias correction exist • the relatively simple one we’ve settled on requires a sufficient retrospective climate model climatology, e.g., • NCEP: hindcast ensemble climatology, 21 years X 10 member • NSIPP-1: AMIP run climatology, > 50 years, 9 member
streamflow forecast skill score bold: GSM signif. better underline: GSM signif. worse Climate Forecasts:“skill deficit” problem • Retrospective skill analysis for NCEP-GSM found: • bias-correction sufficient to put T & P forecasts into plausible range w.r.t. observations • where/when model shows good rank correlation with observations, this can produce a better (than ESP) streamflow forecast • “sweet spots” are few and far between: • -- strong ENSO-anomaly conditions • -- ENSO-sensitive regions
masked for local significance local significance at a 0.05 level (based on a binomial model of success/failure, and assuming zero spatial and zero autocorellation, so that N=21 and p(success)=.33) Skill Assessment:Retrospective analysis tercile prediction skill of GSM ensemble forecast averages, JAN FCST
Westwide streamflow forecast system – experience in winters 2002-3 and 2003-4
Forecasting Project: Background 1998-9 Ohio R. basin w/ COE: First tried climate model-based seasonal forecasts on experimental (retrospective) basis Eastern US: First attempted real-time seasonal forecasts during drought condition in southeastern states -- results published in: Wood et al. (2001), JGR 2000 Columbia R. basin: Implemented approach during the PNW drought, again using climate model based approach 2001 Western US: Retrospective analysis of forecasts over larger domain (for one climate model and for ESP) 2002 Columbia R. basin: New funding for “pseudo-operational” implementation for western US; began with pilot project in CRB 2003 • (Funding from: NASA NSIPP; IRI/ARCS; NOAA GCIP/GAPP) Western US: expanded to western U.S domain for real-time forecasts; working to improve and evaluate methods each forecast cycle 2004
Current season forecasts September/October 2003: Soil Moisture
Current season forecasts November 25: Snow Water Equivalent (SWE) and Soil Moisture
Current season forecasts December 25: Snow Water Equivalent (SWE) and Soil Moisture
Current season forecasts January 25: Snow Water Equivalent (SWE) and Soil Moisture
Current season forecasts February 25: Snow Water Equivalent (SWE) and Soil Moisture
Overview: Streamflow Forecasts hydrographs targeted statistics raw ensemble data
raw ensemble data Streamflow products targeted statistics hydrographs
Comparison with RFC regression forecast for Columbia River at the Dalles UW forecasts made on 25th of each month RFC forecasts made several times monthly: 1st, mid-month, late (UW ESP unconditional forecasts shown) UW RFC
Some obstacles and opportunities in hydrological application of climate information • The “one model” problem • Calibration and basin scale (post-processing as an alternative to calibration) • The value of visualization • Opportunities to utilize non-traditional data (e.g. remote sensing) For more information: www.hydro.washington.edu/Lettenmaier/Projects/fcst/