Download
1 / 22
220 likes | 638 Views
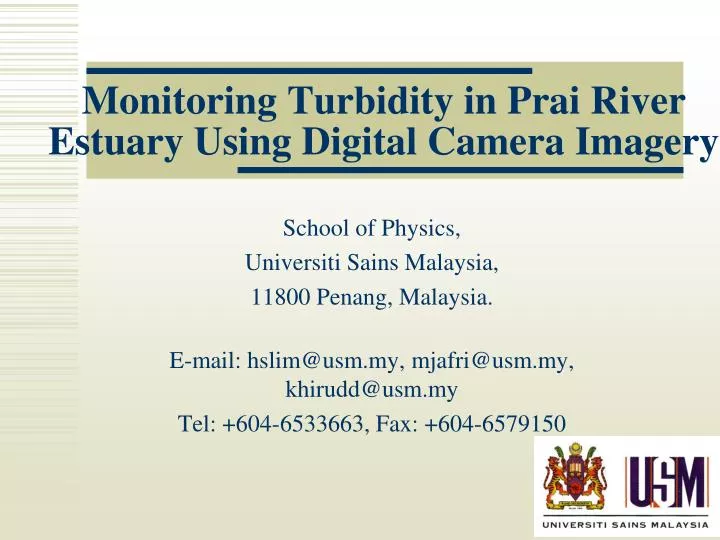
Monitoring Turbidity in Prai River Estuary Using Digital Camera Imagery. School of Physics, Universiti Sains Malaysia, 11800 Penang, Malaysia. E-mail: hslim@ usm.my , mjafri@usm.my, khirudd@usm.my Tel: +604-6533663, Fax: +604-6579150. Presentation Outline. Objective Introduction

E N D
Monitoring Turbidity in Prai River Estuary Using Digital Camera Imagery School of Physics, Universiti Sains Malaysia, 11800 Penang, Malaysia. E-mail: hslim@usm.my, mjafri@usm.my, khirudd@usm.my Tel: +604-6533663, Fax: +604-6579150
Presentation Outline • Objective • Introduction • Study Areas And Data Acquisition • Water Optical Model • Data Analysis and Results • Conclusion
Objective • To evaluate the performance of our empirical turbidity retrieval algorithm for water turbidity mapping.
Introduction • Water quality monitoring is crucial for any effort to produce information in support of water conservation and decision-making. • Traditionally, monitoring of water quality is carried out through shipboard water sampling and laboratory analysis. • Such methods are not only labour-intensive, but sampling is also discrete in time and space. • Remote sensing offers an alternative method for monitoring water bodies on a large scale.
Introduction • Airborne digital camera imageries were selected in this present study because of several reasons. - First, the airborne digital image provides higher spatial resolution data for mapping a small study area. - Second, the airborne digital data acquisition can be carried out according to our planned surveys. The satellite observation times are fixed for a particular study area. - Third, the digital imagery offers many advantages over film-based cameras. • Furthermore, the study areas were located in the equatorial region where the sky is often covered by clouds.
Introduction • An algorithm was generated the retrieval of turbidity distribution. • A normal digital camera, Kodak DC290 was used as a sensor to capture images from a light aircraft, Cessna 172Q, at low altitude of 4400 feet.
Study Areas And Data Acquisition • The study area, Prai River estuary, Penang, Malaysia is located between latitudes 5º 22’ N to 5º 24’ N and longitude 100º 21’ E to 100o 23’ E
Study Areas And Data Acquisition A conventional digital camera Kodak DC290 A light aircraft Cessna 172Q
Study Areas And Data Acquisition Prai estuary
Water Optical Model R()
Water Optical Model • A physical model relating radiance from the water column and the concentrations of the water quality constituents provides the most affective way for analyzing remotely sensed data for water quality studies. • Reflectance is particularly dependent on inherent optical properties: the absorption coefficient and the backscattering coefficient.
Water Optical Model Two water quality components chlorophyll, C, and suspended sediment, P. 2-band equation can be expressed as
3-band Regression Algorithm Research conducted by other studies showed a simple linear regression between turbidity and sediment measurements
Data Analysis and Results • Eight colour digital imageries of the Prai River Estuary were selected for algorithm calibration. • The digital imageries were acquired in visible multispectral (3-bands: red, green and blue). • The size of each raw airborne colour digital image of the Prai river estuary, Penang was 480 pixels by 720 lines. • The eight images were mosaiced together for a bigger coverage area. • The mosaic image was then separated into three bands, (red, green and blue bands) for multispectral analysis using PCI Geomatica 10.1 software package.
Correlation between measured and estimated TSS concentrations
Turbidity Map Map of turbidity near Prai River Estuary [Blue = (< 10 NTU), Green = (10-20) NTU, Orange = (20-30) NTU, yellow = (30-40) NTU, Red = (>40) NTU, Brown = Land and Black = area outside image]
Conclusion • This study showed that the generated algorithm produced accurate result for turbidity mapping. • A bigger converge of study area can be obtained by mosaic several overlapped images. • It also showed that a digital camera could provide useful remotely sensed images for water quality application.
ACKNOWLEDGEMENTS IRPA - MOSTE
Terima Kasih THANK YOU