Download
1 / 20
200 likes | 433 Views
Clinton HIV/AIDS Initiative: Ensuring Availability of HIV/AIDS Supplies May 24, 2006 Content Approach and Outcomes of Original Agreements Current Challenges in the Marketplace and CHAI’s Response Country-level Opportunities to Optimize Access for Patients 5.6 0.4 1.1 4.1 0.3 0.2

E N D
Clinton HIV/AIDS Initiative:Ensuring Availability of HIV/AIDS SuppliesMay 24, 2006 Clinton HIV/AIDS Initiative
Content • Approach and Outcomes of Original Agreements • Current Challenges in the Marketplace and CHAI’s Response • Country-level Opportunities to Optimize Access for Patients
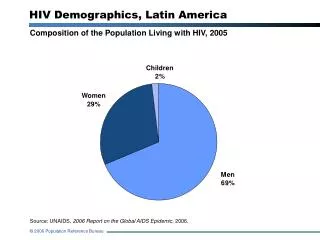
5.6 0.4 1.1 4.1 0.3 0.2 0.05 0.05 Treatment Landscape in 2003 Mission: To bring high-quality care and treatment to people living with HIV/AIDS, and to improve healthcare systems in resource-poor countries Antiretroviral (ARV) treatment landscape, January, 2003 (Millions) Impediments to Access Latin America Outside of Latin America, ARVs only available to 2% of people who need them • Healthcare infrastructure too weak to deliver high quality care • High price of drugs and tests limited purchasing power of countries and made donors wary of investing in treatment • ARVs and CD4 tests alone cost > $500 ppy (Africa) • Drug and lab costs represent 60%-70% of treatment budgets Rest of World Africa # People Need Treatment # People Accessing Treatment
Market Dynamics in 2003 Small, fragmented ARV market kept production costs and prices high • Few patients on treatment • No standardized treatment guidelines • Little donor $ • Small, unpredictable orders/inability to project demand • Late payments Formulators made small batches to order Buyers had little leverage to negotiate better prices CHAI recognized opportunity to stimulate/better organize market and negotiate lower prices for key commodities. Clinton HIV/AIDS Initiative
Develop operational plans Forecast demand Support purchasing Monitor consumption CHAI Engagement with Countries • Set national treatment targets • Quantify requisite resources • Plan for operations, oversight, milestones, etc. • Model scale-up of treatment over time • Set national treatment guidelines • Model product-specific demand • over time • Align policies for procurement • Pool donor funds and sources of orders to create national demand outlook and purchasing process • Deploy tools to sites to monitor ongoing consumption • Use consumption data to update demand forecasts (pull not push)
CHAI Engagement with Suppliers Identify Potential Partners Due Diligence Model Product Cost Negotiate Price • WHO/FDA quality benchmark • Breadth of product selection • Distribution capacity • Conduct site visits at multiple levels of value chain • Understand company position in the marketplace • Map production process • Complete financial due diligence • Un-bundle production costs • Identify major cost drivers • Identify process improvements at each level of value chain • Analyze impact of increased volume on cost • Identify potential for future cost savings • Develop transparent pricing formula • Establish scale curve for future cost/price reductions • Identify product development priorities • Continue to monitor costs
Large reductions at the API level: • Sourcing to low-cost API suppliers, • Driving efficiency through scale, • Reducing gross margin • Reductions in formulation costs: • Cross-subsidization of overhead • Reductions in margin • Scale-based savings (very small) Pharma Value Chain & Targets for Savings 3% 100% 26% R&D 4% Overhead 2% Corporate overhead, sales & marketing Formulation production (excipients, mnfctr, packing) Mnfctr 17% Tax 7% Raw materials 41% Cost of active pharmaceutical ingredient (API) Cost of Final Product Additional cost for formulation manufacturer
ARV Price Comparison: 3TC+d4T(40)+NVP October 2003 January 2006 $562 $562 –75% Overall market prices have fallen as result of our deals –60% $384 $290 $221 $192 $140 $140 Branded Best Price1 Generic Actual Price2 Generic List Price3 CHAI Price Branded Best Price1 Generic Actual Price4 Generic List Price5 CHAI Price • 1 As reported by the manufacturers and by Médecins Sans Frontières (MSF) in Untangling the Web of Price Reductions • $384 was the weighted average price being offered to CHAI purchasers in October 2003. • MSF’s May 2003 guide reported the best prices offered by Cipla, Hetero and Ranbaxy as $304, $281 and $285. • Weighted average of price being paid in middle and low-income countries, according to World Health Organization. • Average price, per MSF’s June 2005 guide, of three suppliers currently WHO prequalified (Cipla, Hetero, Ranbaxy).
Content • Approach and Outcomes of Original Pharmaceutical Agreements • Current Challenges in the Marketplace and CHAI’s Response • Country-level Opportunities to Optimize Access for Patients
Current Challenges in the Marketplace • Ensuring continuous supply of low cost ARVs & diagnostics • Lowering price of additional products • Eliminating price disparity between markets
Cost Pressures on 1st-Line ARVs Production costs for 1st-line ARVs are rising, despite some efficiencies and savings. Continued work is needed to maintain or lower prices. Costs • Rising intermediate prices (and limited supply) • Rising solvent prices (due to increasing price of oil) • Currency exchange fluctuations • Cost of re-listings and double submissions (WHO & FDA) • Increased R&D costs for second-line products • Stock carrying costs, interest rate for late payments, etc. • CHAI response • Work on the supply side to control prices of solvents and intermediates • Work on the demand side to encourage practices which control costs Savings • Better yields than expected • Cheaper routes of synthesis • Increased global volumes
2010 goal: 6–8 million 2006/07: 3 million End 2005: 1–1.5 million Limited API supply API supply has exceeded ART demand to date, but it is not known whether supply of API will keep pace with demand as ART access increases exponentially • Engaging in a forecasting exercise with WHO and UNAIDS • To bridge gaps between API demand and supply, we are assisting new API suppliers, like Mchem in China, to achieve the quality levels needed to export to global markets.
Current Prices of 2nd-Line ARVs Price of 2nd-Line Treatment (Annual cost in US$) Key issues re: 2nd-Line Treatment • Price differential is so high that even small volumes can double national treatment budgets • 5-10% of patients switch to 2nd-line meds each year, so upwards of 0.5 million will be affected in 2 years • Generic supply today is not competitive or non-existent • Supply of meds in greatest demand by branded companies is limited & their prices are not widely available 40x $6,000 10x $1,400 $140 1st Line (Africa) 2nd Line (Africa) 2nd Line (Middle Income) Clinton HIV/AIDS Initiative
Need Lower cost of production Credible demand forecasts Simplified national treatment guidelines Quick regulatory approval Description Current production cannot match innovator pricing due to poor chemistry, low yields and high price intermediates Toxicity and switch rates are not known, and suppliers do not have insight on what 2nd-line drugs are being used New WHO guidelines will have 36 options for combinations without clear pros/cons in terms of cost, availability, etc. Once products are commercially available, WHO approval and national registration are additional prerequisites to wide access CHAI Response & Role Build a team of process and analytical chemistry experts to assist suppliers Work with WHO/UNAIDS to estimate gross demand; with countries to improve estimates of 2nd-line use CHAI will advise governments in the development of their guidelines to assist countries and drive volumes to the most relevant products Support WHO prequalification program to increase capacity and efficiency; encourage prioritization of 2nd-line products with FDA CHAI Activities to Lower 2nd-Line Prices
Price as a barrier for high volume low; cost products Illustrative Projected Testing Volume in CHAI Consortium Countries (millions) # Chemistry & Hematology Tests # CD4 Tests # People in Care # People on ARVs Clinton HIV/AIDS Initiative
Content • Approach and Outcomes of Original Pharmaceutical Agreements • Current Challenges in the Marketplace and CHAI’s Response • Country-level Opportunities to Enhance Product Availability and Quality
Country-level Opportunities • Help Control Product Costs • Expedite National Registration • Build Management Capacity to Effectively Control Supply
Country-level Actions to Control Costs • Demand-side Action • Prompt payment • Larger and/or longer-term tenders • Reliance on international quality standard and ongoing accountability on API sourcing • Splitting awards to tenders for specific, high-volume products • Conducting and sharing ongoing, consumption-based forecasting • Consolidate demand and set standard testing & treatment protocols • Supply-side Impact • Avoids interest payments to minimize costs to formulators • Allows suppliers to plan for production – achieving better pricing on raw materials and avoid stock-carrying costs • Avoids predatory pricing by suppliers who sell lower-quality products (cheaper to make) • Ensures competition so a few products in a few high-volume countries do not determine market • Enables suppliers to plan for medium and long-term capacity needs • Allows suppliers to effectively plan for production and focus R&D
Coordinated planning & budgeting – Tanzania • Government in Tanzania took initiative to coordinate national laboratory planning: • Constructed technical working group • Developed operational plan to guide decision making • Developed rational network of laboratories to control cost and facilitate quality management • Developed national forecasts and budgets • Implemented process to coordinate national laboratory forecasting and budgeting with supply management system being implemented by JSI DELIVER at ART sites and MSD • Saved hundreds of thousands of dollars over the past two years by lowering procurement costs based on aggregate demand forecasts; potential to save hundreds of thousands more by leasing instead of buying • Prevented $2MM budget shortfall for reagent procurement in 2006 by developing national budget and identifying alternate sources of funding • Beginning to see improvements in frequency of supply shortages and instrument service problems
In summary • By engaging both sides of the market and understanding the connections between them, one can begin to remove the barriers that exist to expanding access to products • While there have been some early successes in improving the availability of high quality HIV/AIDS commodities, there are a number of challenges that still exist in the market place that put continued availability at risk • Critical to any effort to address these challenges – and keep the supply of HIV/AIDS commodities sustainable for ever larger numbers of patients – is the actions of countries • By opening communication between stakeholders, inefficiencies in the market can be identified and managed