Download
1 / 18
180 likes | 392 Views
Supercapacitor Market Analysis: End Products (PV, UPS, Cameras, Defibrillators, Wind Turbines, Buses); ype (EDLC, Pseudocapacitors, Hybrid); Application (Energy and Power, Electronics and Transportation) – With Forecast (2015 – 2020)<br><br>Request for Sample Data / Brochure:<br>http://industryarc.com/pdfdownload.aspx?id=212<br>

E N D
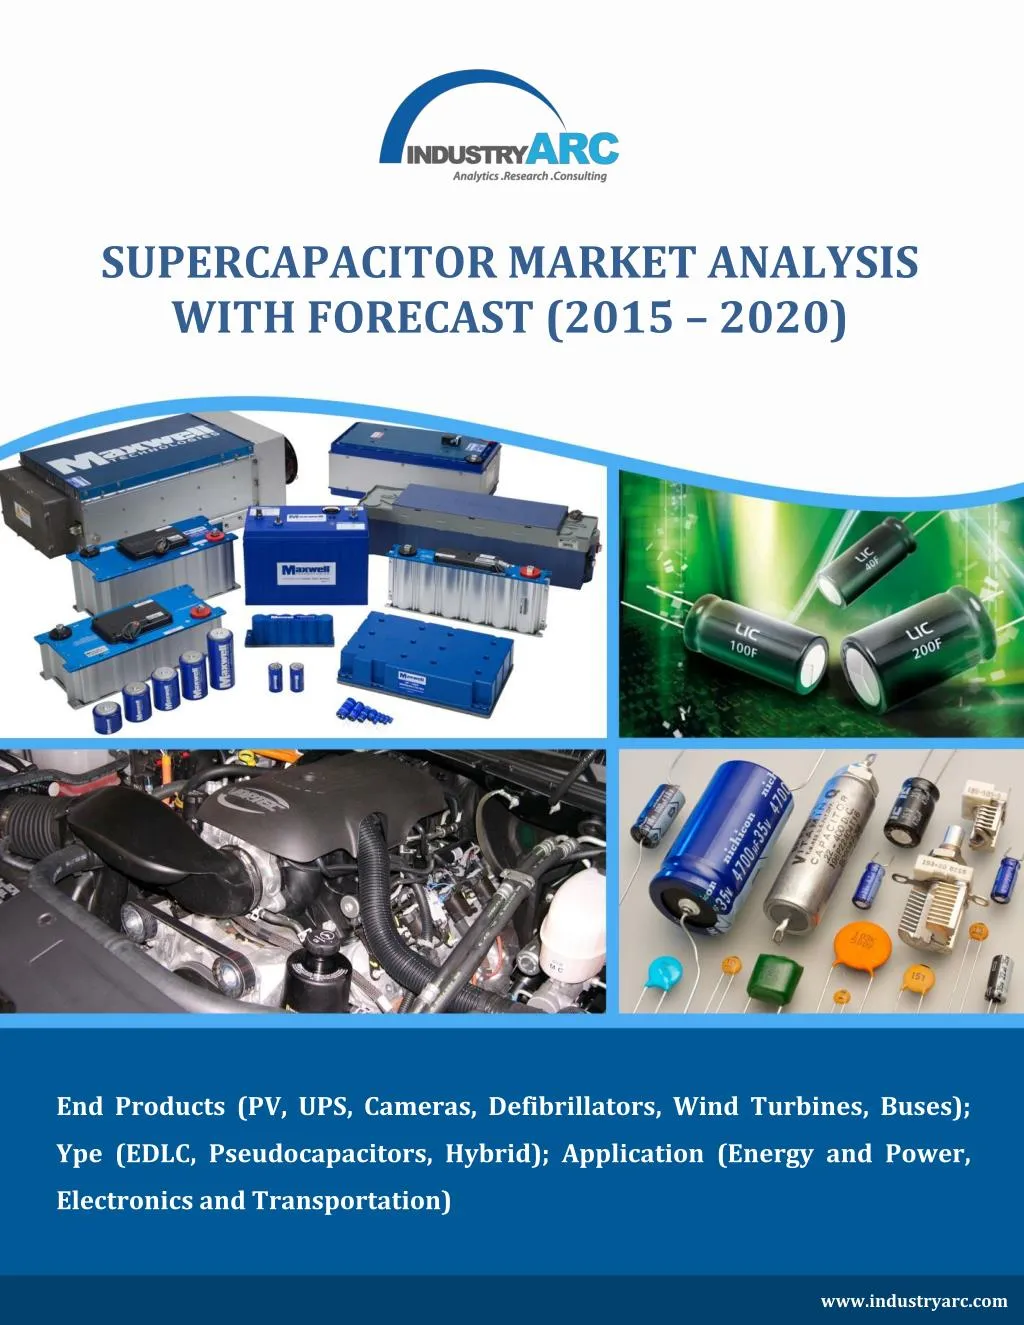
SUPERCAPACITOR MARKET ANALYSIS WITH FORECAST (2015 – 2020) End Products (PV, UPS, Cameras, Defibrillators, Wind Turbines, Buses); Ype (EDLC, Pseudocapacitors, Hybrid); Application (Energy and Power, Electronics and Transportation) www.industryarc.com
To Enquire About the Report Click Here TABLE OF CONTENTS 1Super capacitors Market Overview 1.1Introduction 1.2Segmentation- By Material 1.3Segmentation- By End Product 1.4Segmentation- By Technology 1.5Segmentation- By Geography 2Executive Summary 3Super Capacitors Market Landscape 3.1Market Share Analysis 3.2Super Capacitors – Comparative Analysis 3.2.1Product Benchmarking 3.2.2Super Capacitors Market - Patent Analysis 3.2.3End User Profiling 3.2.4Top Five Financial Analysis 4Super Capacitors Market – Market Forces 4.1Market Drivers 4.1.1Increasing R&D Spend Spurring Super Capacitor Market 4.1.2Advancements In Consumer Electronics Poise To Increase The Adoption of Ultra Capacitors 4.1.3Reducing Cost of Super Capacitors Increase Market Value 4.2Market Constraints 4.2.1Discharge Time and Cost Prove Hurdle To An Extent 4.3Market Challenges 4.3.1Size of Super Capacitors Discourage Integration Across Product Segments 4.3.2Availability of Strong Substitutes Hinder Penetration 4.4Attractiveness of The Industry 4.4.1Power of Suppliers
To Enquire About the Report Click Here 4.4.2Power of Customers 4.4.3Threat of Substitutes 4.4.4Threat of New Entrants 4.4.5Degree of Competition 5Super Capacitors Market – Strategic Analysis 5.1Value Chain Analysis 5.2Pricing Analysis 5.3Opportunities Analysis 5.3.1Technological Breakthroughs In Electric Cars Prove To Be Potential Market For Super Capacitors 5.4Market Life Analysis 5.5Supply Chain Analysis 6Super Capacitors Market: By Material 6.1Introduction 6.2Electrodes 6.3Separators 6.4Electrolyte Double Layer Capacitor (EDLC) 6.4.1Activated Carbons (AC) 6.4.2Carbon Aerogel 6.4.3Activated Carbon Fiber (ACF) 6.4.4Carbide Derived Carbon (CDC) 6.5Pseudo Capacitor 6.5.1Conductive Polymer 6.5.2Metal Oxides 6.6Hybrid Capacitor 6.6.1Polymeric Films 6.6.2Polyacrylonitrle (PAN) 6.6.3Kapton 6.7Others
To Enquire About the Report Click Here 7Supercapacitor Market- By End-Product 7.1Introduction 7.2Industrial Automation Products 7.2.1Memory Storage 7.2.2Uninterrupted Power Supply (UPS) 7.2.3Automatic Meter Reading (AMR) 7.2.4Others 7.3Consumer Electronics Products 7.3.1Laptops 7.3.2Digital Cameras 7.3.3Portable Speakers 7.3.4Mobile Computing 7.3.5Others 7.4Power & Energy Products 7.4.1Actuators 7.4.2Wind Turbines 7.4.3Photovoltaic 7.4.4Others 7.5Healthcare Products 7.5.1Defibrillators 7.5.2Others 7.6Transportation Products 7.6.1Buses 7.6.2Trains and Locomotives 7.6.3Aircrafts 7.6.4Electric Vehicles (EV) 7.6.5Others 8Supercapacitor Market- By Technology 8.1Introduction
To Enquire About the Report Click Here 8.2Organic Electrolyte Super Capacitor 8.3Aqueous Electrolyte Super Capacitor 9Super Capacitors Market: By Application 9.1Introduction 9.2Electronics 9.3Transportation 9.4Energy and Power 9.5Others 10Super Capacitors Market- By Region 10.1Introduction 10.2North America 10.2.1U.S 10.2.2Canada 10.2.3Mexico 10.3Europe 10.3.1Germany 10.3.2U.K 10.3.3France 10.4Asia-Pacific 10.4.1China 10.4.2South Korea 10.4.3Japan 10.4.4Others 10.5ROW 10.5.1Latin America 10.5.2Middle East 10.5.3Africa 11Market Entropy 11.1Most Preferred Strategy
To Enquire About the Report Click Here 11.1.1Product Launch 11.2New Product Launches 12Super Capacitors Market Investment Opportunities 13Company Profiles 13.1AVX Corporation (Kyocera Group) 13.1.1Business Overview 13.1.2Financials 13.1.3Products 13.1.4Strategy 13.1.5Developments 13.2Bombardier Inc. 13.2.1Business Overview 13.2.2Financials 13.2.3Products 13.2.4Strategy 13.2.5Developments 13.3Cap-XX Ltd. 13.3.1Business Overview 13.3.2Financials 13.3.3Products 13.3.4Strategy 13.3.5Developments 13.4Cellergy Ltd (PCB Technologies Ltd.) 13.4.1Business Overview 13.4.2Financials 13.4.3Products 13.4.4Developments 13.5Elna Co. Ltd 13.5.1Business Overview
To Enquire About the Report Click Here 13.5.2Financials 13.5.3Products 13.5.4Strategy 13.5.5Developments 13.6Ls Mtron Ltd 13.6.1Business Overview 13.6.2Financials 13.6.3Products 13.6.4Strategy 13.6.5Developments 13.7KEMET Corporation 13.7.1Business Overview 13.7.2Financials 13.7.3Products 13.7.4Strategy 13.7.5Developments 13.8Ioxus, Inc. 13.8.1Business Overview 13.8.2Financials 13.8.3Products 13.8.4Developments: 13.9Maxwell Technologies, Inc. 13.9.1Business Overview: 13.9.2Financials 13.9.3Business Strategy 13.9.4Products 13.9.5Developments 13.10Nesscap Co. Ltd 13.10.1Business Overview
To Enquire About the Report Click Here 13.10.2Financials 13.10.3Products 13.11Nichicon Corporation 13.11.1Business Overview 13.11.2Financials 13.11.3Products 13.11.4Developments 13.12Optixtal, Inc 13.12.1Business Overview 13.12.2Financials 13.12.3Products 13.12.4Developments 13.13Panasonic Corporation 13.13.1Business Overview 13.13.2Financials 13.13.3Products 13.13.4Strategy 13.13.5Developments 13.14Skeleton Technologies 13.14.1Business Overview 13.14.2Financials 13.14.3Products 13.14.4Strategy 13.14.5Developments 13.15Tecate Group 13.15.1Business Overview 13.15.2Financials 13.15.3Products 13.15.4Strategy
To Enquire About the Report Click Here 13.15.5Developments 13.16Vinatech Co. Ltd. 13.16.1Business Overview 13.16.2Financials 13.16.3Products 13.16.4Strategy 13.16.5Developments
To Enquire About the Report Click Here LIST OF TABLES Table 1 Table 2 Table 3 Table 4 Table 5 Table 6 EDLC Market Revenue, By Electrode Material, 2014 – 2020 ($M) Pseudo Capacitor Market Revenue, By End User Industry, 2014 – 2020 ($M) Pseudo Capacitor Market Revenue, By Electrode Material, 2014 – 2020 ($M) Global Super Capacitors Market Revenue, By End Use Industry, 2014-2020 ($M) Industrial Automation Market Revenue, By Type, 2014-2020 ($M) Industrial Automation Products Market Revenue, By Geography, 2014-2020 ($M) Table 7 Table 8 Consumer Electronics Products Market Revenue, By Type, 2014-2020 ($M) Consumer Electronics Products Market Revenue, By Geography, 2014-2020 ($M) Table 9 Table 10 Table 11 Table 12 Table 13 Table 14 Table 15 Table 16 Table 17 Table 18 Power & Energy Products Market Revenue, By Type, 2014-2020 ($M) Power & Energy Products Market Revenue, By Geography, 2014-2020 ($M) Healthcare Products Market Revenue, By Type, 2014-2020 ($M) Healthcare Products Market Revenue, By Geography, 2014-2020 ($M) Transportation Products Market Revenue, By Geography, 2014-2020 ($M) Global Super Capacitors Market Revenue, By Technology, 2014-2020 ($M) Organic Electrolyte Super Capacitor Market, By Geography, 2014-2020 ($M) Aqueous Electrolyte Super Capacitor Market, By Geography, 2014-2020 ($M) Global Super Capacitors Market Revenue, By Application, 2014-2020 ($M) Global Super Capacitors Market Revenue, By Application, Electronics Segment, 2014-2020 ($M) Table 19 Table 20 Table 21 Table 22 Table 23 Table 24 Table 25 Table 26 Electronics Market Revenue, By Geography, 2014-2020 ($M) Transportation Market Revenue, By Geography, 2014-2020 ($M) Energy and Power Market Revenue, By Geography, 2014-2020 ($M) Others Market Revenue, By Geography, 2014-2020 ($M) Global Super Capacitors Market Revenue, By Geography, 2014-2020 ($M) North America Super Capacitors Market Revenue, By Country, 2014-2020 ($M) North America Super Capacitors Market Revenue, By Material, 2014-2020 ($M) North America Super Capacitors Market Revenue, By Technology, 2014-2020 ($M)
To Enquire About the Report Click Here Table 27 North America Super Capacitors Market Revenue, By End Use Industry, 2014-2020 ($M) Table 28 Table 29 Table 30 Table 31 Europe Super Capacitors Market Revenue, By Country, 2014-2020 ($M) Europe Super Capacitors Market Revenue, By Material, 2014-2020 ($M) Europe Super Capacitors Market Revenue, By Technology, 2014-2020 ($M) Europe Super Capacitors Market Revenue, By End Use Industry, 2014-2020 ($M) Table 32 Table 33 Table 34 Table 35 APAC: Supercapacitors Market Revenue By Country, 2014-2020, ($M) APAC: Supercapacitors Market Revenue By Material, 2014-2020, ($M) APAC: Supercapacitors Market Revenue By Technology, 2014-2020, ($M) APAC: Supercapacitors Market Revenue By End-Use Industry, 2014-2020, ($M) Table 36 Table 37 Table 38 Table 39 Table 40 Table 41 Table 42 Table 43 Table 44 Table 45 Table 46 Table 47 Table 48 Table 49 APAC: Supercapacitors Market Revenue By Application, 2014-2020, ($M) Row: Super Capacitors Market Revenue By Region, 2014-2020, ($M) Row: Supercapacitors Market Revenue By Materials, 2014-2020, ($M) Row: Supercapacitors Market Revenue By Materials, 2014-2020, ($M) Row: Supercapacitors Market Revenue By End-Use Industry, 2014-2020, ($M) Row: Supercapacitors Market Revenue By Application, 2014-2020, ($M) Funds Raised, By Company, 2014-2015 ($M) Kyocera Group: Revenue By Geography 2014-2015 ($Bn) Bombardier Inc.: Revenue By Geography 2013-2014 ($Bn) Cap-XX Ltd: Revenue By Geography 2013-2014 ($M) KEMET Corporation: Revenue By Geography 2014-2015 ($M) Maxwell Technologies; Annual Revenue, By Geography, 2013-2014 ($M) Nesscap; Annual Revenue, By Geography, 2013-2014 ($M) Nichicon Corporation; Annual Revenue, By Geography, 2013-2014 ($M)
To Enquire About the Report Click Here LIST OF FIGURES Figure1 Figure2 Figure3 Figure4 Figure5 Super Capacitors Market Classification – By Geography Global Super Capacitor Market Revenue, 2014-2020 ($M) Super Capacitor Market Revenue, By Geographic Regions, 2014 (%) Super Capacitors Market Share Analysis, 2014 (%) Super Capacitor Market- Patent Analysis, By Year, 2011-2015 (Number of Patents) Figure6 Figure7 Figure8 Figure9 Figure10 Figure11 Figure12 Figure13 Figure14 Figure15 Figure16 Figure17 Figure18 Figure19 Figure20EDLC Super Capacitor Market Revenue, By Geography, 2014 – 2020 ($M) Figure21 Pseudo Capacitor Market Revenue, By Application, 2014 – 2020 ($M) Figure22Pseudo Capacitor Market Revenue, By Geography, 2014 – 2015 ($M) Figure23Separators Market Revenue, By Type, 2014 – 2020 ($M) Figure24Memory Storage Market Revenue, By Type 2014-2020 ($M) Figure25Uninterrupted Power Supply (UPS) Market Revenue, By Type 2014-2020 ($M) Figure26Automatic Meter Reading (AMR) Market Revenue, By Type 2014-2020 ($M) Figure27Others Market Revenue, By Type 2014-2020 (In $M) Figure28Laptops Market Revenue, By Type 2014 - 2020 (In $M) Figure29Digital Cameras Market Revenue, By Type 2014 - 2020 (In $M) Super Capacitor Market- Patent Analysis, By Company, 2013-2015 (%) Battery Charging Time: Super Capacitor Vs Battery Price of Super Capacitor, 2004-2015, ($) Lithium Ion Battery Market ($ Billion) Price of Super Capacitor, 2004-2015, ($) Price Per Capacitance, Super Capacitor, 2004-2015, ($) Price, 2015 ($): Super Capacitor Vs Lithium Ion Electric Vehilces Shipment Forecast 2014-2020 (Million Units) Market Life Analysis: Super Capacitors Super Capacitors Segmentation By Component Material Electrode Material Super Capacitors Type Super Capacitors Market Revenue, By Material Type, 2014 – 2020 ($M) EDLC Market Revenue, By Application, 2014 – 2020 ($M) EDLC Capacitor Market Revenue, By End User Industry, 2014 – 2020 ($M)
To Enquire About the Report Click Here Figure30Portable Speakers Market Revenue, By Type 2014 - 2020 (In $M) Figure31 Figure32Others Market Revenue, By Type 2014 - 2020 (In $M) Figure33Actuators Market Revenue, By Type 2014 - 2020 (In $M) Figure34Wind Turbines Market Revenue, 2014 - 2020 (In $M) Figure35Photovoltaic Market Revenue, By Type 2014 - 2020, (In $M) Figure36Others Market Revenue, By Type, 2014 - 2020 (In $M) Figure37Defibrillators Market Revenue, By Type, 2014 - 2020 (In $M) Figure38Others Market Revenue, By Type 2014 - 2020 (In $M) Figure39Trains and Locomotives Market Revenue, By Type, 2014 - 2020 (In $M) Figure40Aircrafts Market Revenue, By Type 2014 - 2020 (In $M) Figure41 Electric Vehicle Market Revenue, By Type, 2014 - 2020 (In $M) Figure42Other Market Revenue, By Type, 2014 - 2020 (In $M) Figure43Global Super Capacitors Market Revenue, Organic Electrolyte Super Capacitor, Mobile Computing Market Revenue, By Type 2014 - 2020 (In $M) 2014-2020 ($M) Figure44Global Super Capacitors Market Revenue, Aqueous Electrolyte Super Capacitor, 2014-2020 ($M) Figure45Global Super Capacitors Market Revenue, Transportation Segment, 2014-2020 ($M) Figure46Global Super Capacitors Market Revenue, Energy and Power, 2014-2020 ($M) Figure47Global Super Capacitors Market Revenue, Other Applications, 2014-2020 ($M)
To Enquire About the Report Click Here KEY INSIGHTS The growing demand for electric vehicles and trams is set to increase the Super Capacitors shipments significantly Chinese firms are forecast to account for a majority share of the market by 2020, due to high demand in Asian markets coupled with production, distribution efficiencies of the companies. Healthcare is in the forefront in adoption of super capacitors and is estimated to grow at highest annual growth rate until 2020. The majority market share in super capacitor market is held by consumer electronics followed by transportation segment in 2014. Electric Vehicles, whose shipments are estimated to reach 6.3 million units by 2022, is a huge opportunity for the super capacitor manufacturers. The prices of the super capacitors have come down significantly by over 90% from 2004. In past two to three years alone, the prices have fallen by 85%. The potential regions to invest are China, Japan and North America owing to the increasing transportation market. The top three players together constituted for 48% of the market share in 2014. The largest orders are being placed in China and elsewhere in East Asia for protecting bus traction batteries, enhancing performance and for harvesting the braking energy of trains.
To Enquire About the Report Click Here RESEARCH METHODOLOGY The quantitative and qualitative data collected for the global Supercapacitor report is from a combination of secondary and primary sources. Research interviews were conducted with executives and/or mangers in the key product manufacturers and related organizations. These Key Opinion Leaders (KOLs) were then provided a questionnaire to gather quantitative and qualitative inputs on their operations, performance, strategies and views on the overall market, including key developments and trends. Data from interviews is consolidated, checked for consistency and accuracy, and the final market numbers are again validated by experts. The global Supercapacitor was split by grades of polycarbonate resins, applications and geography based on different factors like primary and secondary sources, understanding of the number of companies operating in each segment and also KOL insights. We have used various secondary sources such as directories, articles, white papers, newsletters, annual reports and paid databases such as OneSource, Hoovers and Factiva to identify and collect information for extensive commercial study of the global Supercapacitor. The approach towards finding information regarding the market and forecasting has been quite extensive. The key players in the market and its value chain were identified through secondary research and their market opinions were also gathered in a similar way through telephonic interviews and questionnaires. Interviews with key opinion leaders such as managers and marketing personnel were used extensively in understanding the need and emergence of polycarbonate resin market. We also have extensive database of contacts which were used to conduct primary interviews and also to get their inputs using questionnaires.
To Enquire About the Report Click Here THE ARC ADVANTAGE An analytical model lies at the core of our process, ensuring logical consistency throughout our research. We complement the model with secondary data and interviews with industry experts to reflect the latest trends. With our final expert validation, we provide you with only the most accurate and actionable intelligence. THE ARC PROCESS Base Method Analytical Method Consolidation Method Delphi Verification 1. Granular breakdown of drivers into factors 2. Validate all factors in terms of their present impact on the market 3. Assign weights to these factors in terms of their relevance and impact on the market 4. Build the Analytical Model 1. Get a top- down estimate of the market 2. Follow it up with a bottom-up estimate of the market 3. Check forconsistency and new growth factors that are relevant over the next 10 Years 4. Build the Base model 1. Granular breakdown of drivers into factors 2. Validate all factors in terms of their present impact on the market. 3. Assign weights to these factors in terms of their relevance and impact on the market. 4. Build the Consolidated Model 1. Verify the findings of the model with experts from across the value chain 2. Verify the findings with players across small and large enterprises 3. Tweak the model and add new factors 4. Finalize the ARC Model ANALYTICAL MODEL BASE MODEL CONSOLIDATED MODEL ARC MODEL
To Enquire About the Report Click Here ABOUT US IndustryARC was started by a group of young, passionate professionals along with extensively experienced industry veterans across various business segments. Our focus and expertise is mainly in the field of analytics, market research and consulting. Our singular goal is to provide accurate and affordable research to our clients. Our research team has expertise in diverse fields like Automotive, Chemicals,Consumer Product & Services, Electronics, Food & Beverages, Healthcare etc., However diverse the expertise maybe, everyone in our team shares one common trait - we love data and we love providing solutions to clients using that data even more! Seeing your business flourish based on our solutions and strategy is what we love the most! IndustryARC publishes more than 30 reports on an annual basis in the mentioned Industries. Our reports are in-depth and high quality reports that can help decision makers frame better strategies for their business requirements. These reports can be further customized as per your needs. Disclaimer: The reports sold by IndustryARC are limited publications containing valuable market information provided to a select group of customers in response to orders. Our customers acknowledge and agree that any report bought from IndustryARC is for their own internal use and not for general publication or disclosure to third parties. Our reports or part of the reports, information contained in the report, cannot be shared or resold to any other third party. Disclosure to third parties, usage of data in a public document, article or blog by the customer can be done with prior permission taken from IndustryARC. For information regarding permissions and sales, contact: sales@industryarc.com | sanjay.matthews@industryarc.com
To Enquire About the Report Click Here IndustryARC +1 614 - 588 - 8538 sales@industryarc.com Copyright ©2015 IndustryARC All Rights Reserved. This document contains highly confidential information and is the sole property of IndustryARC. No part of it may be circulated, copied, quoted, or otherwise reproduced without the approval of IndustryARC.