Download
1 / 14
140 likes | 380 Views
3D Sensors Market Analysis: Sensing Technology (Interactive Displays, Capacitive, Infrared, Ultrasonic, Electric Field, Image Sensor, MEMS); Verticals (Consumer Electronics, Automotive, Robotics, Industrial Automation) - Forecast (2015 - 2020)<br><br>Request for Sample Data / Brochure:<br>http://industryarc.com/pdfdownload.aspx?id=244<br>

E N D
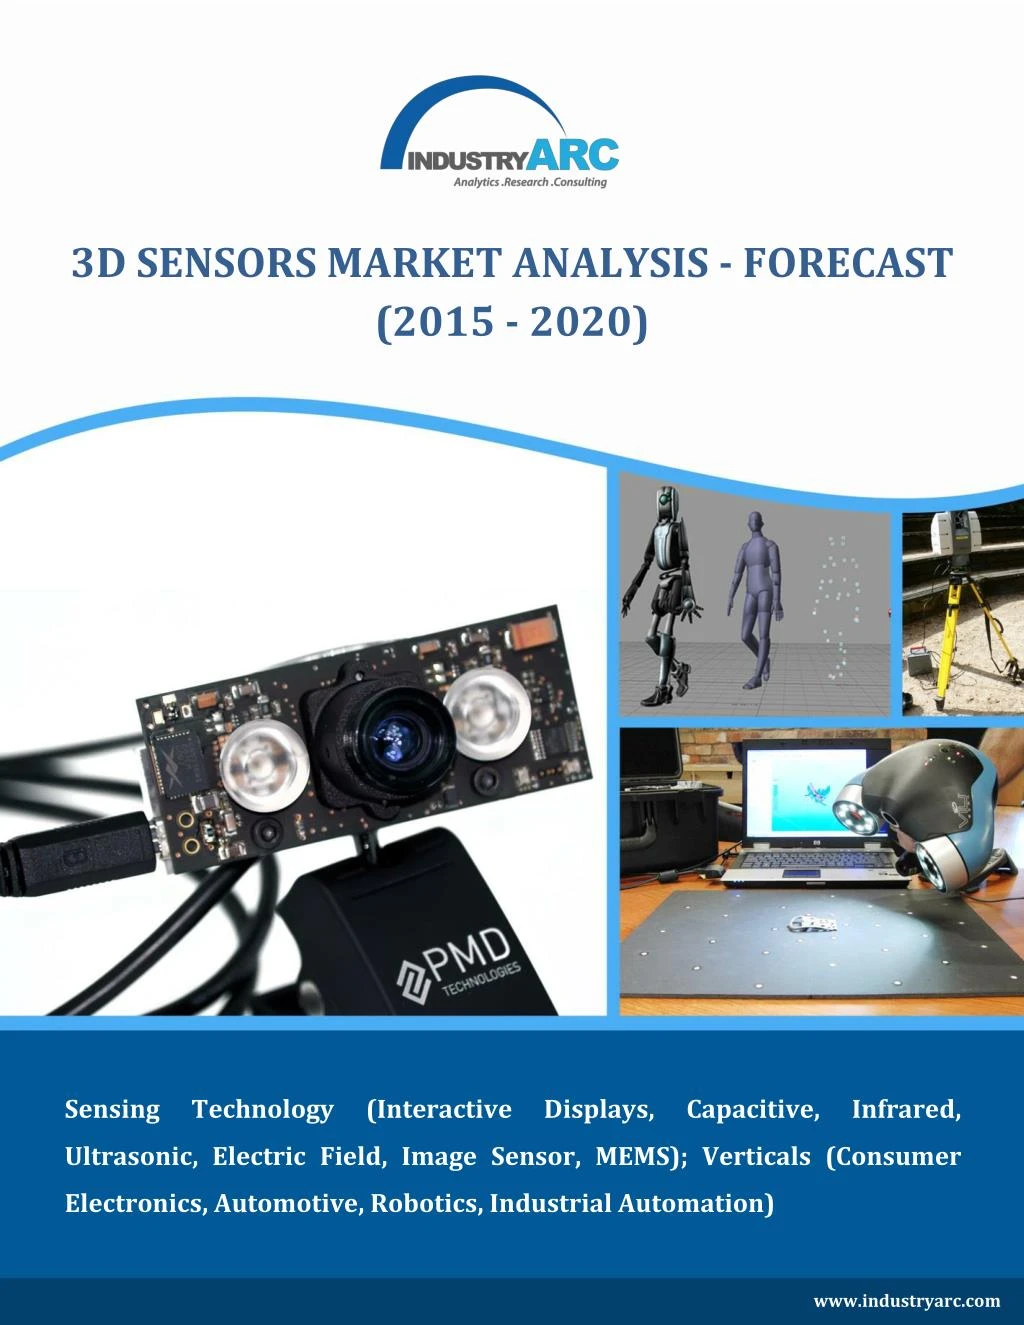
3D SENSORS MARKET ANALYSIS - FORECAST (2015 - 2020) Sensing Technology (Interactive Displays, Capacitive, Infrared, Ultrasonic, Electric Field, Image Sensor, MEMS); Verticals (Consumer Electronics, Automotive, Robotics, Industrial Automation) www.industryarc.com
To Enquire About the Report Click Here TABLE OF CONTENTS 1.3D SensorMarket Overview 2.Executive Summary 3.3D SensorMarket Landscape 3.1.Market Share Analysis 3.2.Comparative Analysis 3.2.1.Product Benchmarking 3.2.2.End user profiling 3.2.3.Patent Analysis 3.2.4.Top 5 Financials Analysis 4.3D SensorMarket Forces 4.1.Market Drivers 4.2.Market Constraints 4.3.Market Challenges 4.4.Attractiveness of the3D SensorsIndustry 4.4.1.Power of Suppliers 4.4.2.Power of Customers 4.4.3.Threat of New entrants 4.4.4.Threat of Substitution 4.4.5.Degree of Competition 5.3D SensorMarket– Strategic Analysis 5.1.Value Chain Analysis 5.2.Pricing Analysis 5.3.Opportunities Analysis 5.4.Product/Market Life Cycle Analysis 6.3D Sensor Market – By Consumer Electronics Products 6.1.Smartphone’s 6.2.Gaming Devices 6.3.Laptops
To Enquire About the Report Click Here 6.4.Televisions 6.5.Tablet PCs 6.6.Set Top Boxes 6.7.Wearable Devices 6.8.Household Appliances 6.9.Others 7.3D Sensor Market – By Key Technology Types 7.1.Interactive Displays 7.2.Capacitive Sensing 7.3.Infrared Sensing 7.4.Ultrasonic 7.5.Electric Field 7.6.Image Sensor 7.7.MEMS 7.7.1.Position 7.7.2.Pressure 7.7.3.Accelerometer 7.7.4.Gyroscopes 7.8.Camera based recognition 3D 7.9.Others 8.3D Sensor Market – By End Use Verticals 8.1.Consumer Electronics 8.2.Automotive 8.3.Industrial Automation 8.4.Robotics 8.5.Medical Devices 8.6.Aerospace 8.7.Defense 8.8.Others
To Enquire About the Report Click Here 9.3D SensorMarket-Geographic Analysis 9.1.Introduction 9.2.Americas 9.2.1.USA 9.2.2.Canada 9.2.3.Mexico 9.3.Europe 9.3.1.Germany 9.3.2.UK 9.3.3.France 9.3.4.Italy 9.4.APAC 9.4.1.China 9.4.2.South Korea 9.4.3.Japan 9.4.4.India 9.5.ROW 10.Market Entropy 10.1.New Product Launches 10.2.M&As, Collaborations, JVs and Partnerships 11.Investment Opportunities – Analysis by Target companies/customers, Capital Investments, ROI, Payback Period and Source of Funds. 12.Company Profiles 12.1.PMD technologies 12.2.Microchip Technologies 12.3.Movea SA 12.4.Omnivision 12.5.Pointgrab 12.6.Qualcomm Inc
To Enquire About the Report Click Here 12.7.Reactrix 12.8.Samsung Electronics 12.9.Softkinetic 12.10.Sony Corp 12.11.Texas Instruments 12.12.Cognivue Corp 12.13.Cross Match Technologies 12.14.Elliptic Labs 12.15.Eyesight Tech 12.16.Fluid Motion 12.17.Gestigon Gmbh 12.18.Gestsure Technologies 12.19.Gesturetek 12.20.Intel Corporation 12.21.Infineon Technologies 12.22.Leap Motion 12.23.Ifm electronic 13.Appendix 13.1.Abbreviations 13.2.Sources 13.3.Research Methodology 13.4.Bibliography 13.5.Compilation of Expert Insights 13.6.Disclaimer
To Enquire About the Report Click Here LIST OF TABLES Table 1 Table 2 Table 3 Table 4 Table 5 Table 6 Table 7 Table 8 Table 9 Table 10Television Market Volumes By Region, 2014-2020 (Million Units) Table 11Tablet pc’s Market Revenue By Region, 2014-2020 ($million) Table 12Tablet pc’s Market Volume By Region, 2014-2020 (Million Units) Table 13Setup Boxes Market Revenue By Region, 2014-2020 ($million) Table 14Setup Boxes Market Volume By Region, 2014-2020 (Million Units) Table 15Wearable’s Market Revenue By Region, 2014-2020 ($million) Table 16Wearable’s Market Volume By Region, 2014-2020 (Million Units) Table 17Home Automation Market Revenue By Region, 2014-2020 ($million) Table 18Home Automation Market Volumes By Region, 2014-2020 (Million Units) Table 193D Sensors Market Revenue, By Technology, 2014-2020 ($million) Table 203D Sensors Market Volume, By Technology, 2014-2020 ($million) Table 21Interactive Displays Market Revenue, By Application, 2014-2020 ($million) Table 22Interactive Displays Market Volume, By Application, 2014-2020 (Million Units) Table 23Interactive Displays Market Revenue, By Application, 2014-2020 ($million) Table 24Interactive Displays Market Volume, By Application, 2014-2020(Million Units) Table 25Capacitive sensing Market Revenue, By Application, 2014-2020 ($million) Table 26Capacitive Sensing Market Volumes, By Application, 2014-2020 (Million Units) Table 27Capacitive Sensing Market Revenue, By Application, 2014-2020 ($million) Table 28Capacitive Sensing Market Volumes, By Application, 2014-2020 (Million Units) Table 29Infrared Sensing Market Revenue, By Application, 2014-2020 ($million) Table 30Infrared Sensing Market Volumes, By Application, 2014-2020 (Million Units) 3D Sensor Market Revenue, 2014-2020 ($million) 3D Sensors Market Volume, By consumer electronics, 2014-2020 ($million) Smart Phone Market Revenue By Region, 2014-2020 ($millionillion) Smart Phone Market Volumes By Region, 2014-2020 (Million Units) Gaming Devices Market Revenue By Region, 2014-2020 ($million) Gaming Devices Market Volume By Region, 2014-2020 (Million Units) Laptops Market Revenue By Region, 2014-2020 ($million) Laptop Market Volumes By Region, 2014-2020 (Million Units) Television Market Revenue By Region, 2014-2020 ($million)
To Enquire About the Report Click Here Table 31Infrared Sensing Market Revenue, By Application, 2014-2020 ($million) Table 32Infrared Sensing Market Volumes, By Application, 2014-2020 (Million Units) Table 33Ultrasonic Market Revenue, By Application, 2014-2020 ($million) Table 34Ultrasonic Market Volumes, By Application, 2014-2020 (Million Units) Table 35Ultrasonic Market Revenue, By Application, 2014-2020 ($million) Table 36Ultrasonic Market Volumes, By Application, 2014-2020 (Million Units) Table 37Electric Field sensors Market Revenue, By Application, 2014-2020 ($million) Table 38Electric Field sensors Market Volume, By Application, 2014-2020 (Million Units) Table 39Electric Field 3D Sensor Market Revenue, By Application, 2014-2020 ($million) Table 40Electric Field 3D Sensor Market Volume, By Application, 2014-2020 (Million Units) Table 41Image Sensor Market Revenue, By Application, 2014-2020 ($million) Table 42Image Sensor Market Volumes, By Application, 2014-2020 (Million Units) Table 43Image Sensor Market Revenue, By Application, 2014-2020 ($million) Table 44Image Sensor Market Volumes, By Application, 2014-2020 (Million Units) Table 45MEMS Market Revenue, By Application, 2014-2020 ($million) Table 46MEMS Market Volume, By Application, 2014-2020 (Million Units) Table 47MEMS Market Revenue, By Application, 2014-2020 ($million) Table 48MEMS Market Volume, By Application, 2014-2020 (Million Units) Table 49Camera based recognition 3D Sensor Market Revenue, By Application, 2014-2020 ($million) Table 50Camera based recognition 3D Sensor Market Revenue, By Application, 2014-2020 ($million) Table 51Camera based recognition 3D Market Revenue, By Application, 2014-2020 ($million) Table 52Camera based recognition 3D Market Volume, By Application, 2014-2020 (Million Units) Table 533D Sensors Market Revenue, By End user Application, 2014-2020 ($million) Table 543D Sensors Market Volume, By End user applications, 2014-2020 ($million) Table 55Consumer Electronics Market Revenue, By Geography 2014-2020 ($million) Table 56Consumer Electronics Market Volume, By Geography 2014-2020 (Million Units) Table 57Automotive Market Revenue, By Geography 2014-2020 ($million) Table 58Automotive Market Volume, By Geography 2014-2020 (Million Units)
To Enquire About the Report Click Here Table 59Industrial Automation Market Revenue, By Geography 2014-2020 ($million) Table 60Industrial Automation Market Volume, By Geography 2014-2020 (Million Units) Table 61Robotics Market Revenue, By Geography 2014-2020 ($million) Table 62Robotics Market Volume, By Geography 2014-2020 (Million Units) Table 63Medical Devices Market Revenue, By Geography 2014-2020 ($million) Table 64Medical Devices Market Volume, By Geography 2014-2020 (Million Units) Table 65Aerospace Market Revenue, By Geography 2014-2020 ($million) Table 66Aerospace Market Volume, By Geography 2014-2020 (Million Units) Table 67Defence Market Revenue, By Geography 2014-2020 ($million) Table 68Defence Market Volume, By Geography 2014-2020 (Million Units) Table 69Others Market Revenue, By Geography 2014-2020 ($million) Table 70Others Market Volume, By Geography 2014-2020 (Million Units) Table 713D Sensor Shipments, By Geography, 2014-2020 (Million Units) Table 723D Sensor Market, By Geography, 2014-2020 ($million) Table 73Americas 3D Sensor Market, By Geography, 2014-2020 ($million) Table 74Americas 3D Sensor Devices Shipments, By End Product, 2014-2020 (Million Units) Table 75Table75 Americas 3D Sensor Devices Market, By Product, 2014-2020 ($million) Table 76European 3D Sensor Market, By Geography, 2014-2020 ($million) Table 77European 3D Sensor Devices Shipments, By End Product, 2014-2020 (Million Units) Table 78European 3D Sensor Devices Market, By Product, 20132020 ($million) Table 79European 3D Sensor Market, By Geography, 2014-2020 ($million) Table 80APAC 3D Sensor Devices Shipments, By End User Application, 2014-2020 (Million Units) Table 81APAC 3D Sensor Devices Market, By Product, 2014-2020 ($million) Table 82ROW 3D Sensor Devices Shipments, By End User Application, 2014-2020 (Million Units) Table 83APAC 3D Sensor Devices Market, By Product, 2014-2020 ($million)
To Enquire About the Report Click Here LIST OF FIGURES Figure1 Figure2 Figure3 Figure4 Figure5 Figure6 Figure7 Figure8 Figure9 Figure103D Sensor Patent Analysis, By Year, 2013-2015 (Number of Patents) Figure113D Sensor Patent Analysis, By Company, 2013-2015 (%) Figure12Consumer electronics shipments 20132014 (Million Units) Figure13Average 3D Sensor Average Price, 2014-2020 ($) Figure143D Sensor Market Value Chain Analysis Figure153D Sensors Market, Pricing Analysis, By End user Industries, 2014-2020 ($) Figure163D Sensors Market, Pricing Analysis, By Geographies, 2014-2020 ($) Figure173D Sensor Industry Life Cycle Analysis Figure183D Sensor Product Life Cycle Analysis Figure193D Sensor Market, By Geography, 2014 (%) Figure20Top 3D Sensor Companies in America region Figure21Americas Wrist Wearable Devices Market, By Geography, 2014 (%) Figure22Top 3D Sensor Companies in Europe Region Figure23Europe Wrist Wearable Devices Market, By Geography, 2014 (%) Figure24Top 3D Sensor Companies in APAC Region Figure25APAC 3D Sensor Market, By Geography, 2014 (%) Figure26Top 3D Sensor Companies in ROW Region Figure273D Sensor Strategy Share, 2011-2014 (%) Figure283D Sensor Developments, By Company, 2011-2014 (%) Figure293D sensor products launch 2012-2015(till now) (%) Figure303D Sensor Product Launches, By Key Players, 2011-2014 3D Sensor Market Segmentation – By End Use Verticals 3D Sensor Market – By Key Technology Types 3D Sensor Market – By Consumer Electronics Products 3D Sensors Market Share, By Type, 2014 (%) 3D Sensors Market Revenue, By End User Application, 2014 ($million) 3D Sensors Market Share, By Geography, 2014 (%) 3D Sensors Market Revenue, By Consumer electronics, 2014 ($million) 3D sensor Market Share Analysis, 2014 (%) 3D Sensor Market, By End Use Industry, 2014 (%)
To Enquire About the Report Click Here KEY INSIGHTS The Global 3D Sensor Market in Consumer Electronics has been segmented and analyzed based on the key end use industries like automotive, consumer electronics, industrial automation etc and technologies like IR, ultrasound, capacitive, electric field sensing and so on. Industry 4.0 (4th Industrial revolution) is set to start, which is a big opportunity for 3D sensor market to grow. Tablet PCs and Smartphones are the top growing consumer electronics product segments using gesture recognition in the next 5 years. Gesture recognition is also slowly penetrating the home automation sector for smarter devices manufacturing. Pmd technologies joined forces with Invensense to develop 3D camera and Gesture recognition solutions for many devices including desktops, laptops, notebooks, ultrabooks, AIO PCs and tablets. On January, 2012 pmd technologies a ToF sensor named Photon IC’s. This is first commercially available ToF sensor. It is very help full in gesture recognition. On September, 2014 Intel Corporation launched a 3D Camera with its own 3D Sensors named RealSense camera for laptops. Apple acquired LinX a smart phone camera manufacturer to produce 3D camera which can act as a competitor for Intel Realsense camera. On January, 2012 pmd technologies launched a ToF sensor named Photon IC’s. This is first commercially available ToF sensor. It is very help full in gesture recognition.
To Enquire About the Report Click Here RESEARCH METHODOLOGY The quantitative and qualitative data collected for the global 3D Sensors report is from a combination of secondary and primary sources. Research interviews were conducted with executives and/or mangers in the key product manufacturers and related organizations. These Key Opinion Leaders (KOLs) were then provided a questionnaire to gather quantitative and qualitative inputs on their operations, performance, strategies and views on the overall market, including key developments and trends. Data from interviews is consolidated, checked for consistency and accuracy, and the final market numbers are again validated by experts. The global 3D Sensors was split by grades of polycarbonate resins, applications and geography based on different factors like primary and secondary sources, understanding of the number of companies operating in each segment and also KOL insights. We have used various secondary sources such as directories, articles, white papers, newsletters, annual reports and paid databases such as OneSource, Hoovers and Factiva to identify and collect information for extensive commercial study of the global 3D Sensors. The approach towards finding information regarding the market and forecasting has been quite extensive. The key players in the market and its value chain were identified through secondary research and their market opinions were also gathered in a similar way through telephonic interviews and questionnaires. Interviews with key opinion leaders such as managers and marketing personnel were used extensively in understanding the need and emergence of polycarbonate resin market. We also have extensive database of contacts which were used to conduct primary interviews and also to get their inputs using questionnaires.
To Enquire About the Report Click Here THE ARC ADVANTAGE An analytical model lies at the core of our process, ensuring logical consistency throughout our research. We complement the model with secondary data and interviews with industry experts to reflect the latest trends. With our final expert validation, we provide you with only the most accurate and actionable intelligence. THE ARC PROCESS Base Method Analytical Method Consolidation Method Delphi Verification 1. Granular breakdown of drivers into factors 2. Validate all factors in terms of their present impact on the market 3. Assign weights to these factors in terms of their relevance and impact on the market 4. Build the Analytical Model 1. Get a top- down estimate of the market 2. Follow it up with a bottom-up estimate of the market 3. Check forconsistency and new growth factors that are relevant over the next 10 Years 4. Build the Base model 1. Granular breakdown of drivers into factors 2. Validate all factors in terms of their present impact on the market. 3. Assign weights to these factors in terms of their relevance and impact on the market. 4. Build the Consolidated Model 1. Verify the findings of the model with experts from across the value chain 2. Verify the findings with players across small and large enterprises 3. Tweak the model and add new factors 4. Finalize the ARC Model ANALYTICAL MODEL BASE MODEL CONSOLIDATED MODEL ARC MODEL
To Enquire About the Report Click Here ABOUT US IndustryARC was started by a group of young, passionate professionals along with extensively experienced industry veterans across various business segments. Our focus and expertise is mainly in the field of analytics, market research and consulting. Our singular goal is to provide accurate and affordable research to our clients. Our research team has expertise in diverse fields like Automotive, Chemicals,Consumer Product & Services, Electronics, Food & Beverages, Healthcare etc., However diverse the expertise maybe, everyone in our team shares one common trait - we love data and we love providing solutions to clients using that data even more! Seeing your business flourish based on our solutions and strategy is what we love the most! IndustryARC publishes more than 30 reports on an annual basis in the mentioned Industries. Our reports are in-depth and high quality reports that can help decision makers frame better strategies for their business requirements. These reports can be further customized as per your needs. Disclaimer: The reports sold by IndustryARC are limited publications containing valuable market information provided to a select group of customers in response to orders. Our customers acknowledge and agree that any report bought from IndustryARC is for their own internal use and not for general publication or disclosure to third parties. Our reports or part of the reports, information contained in the report, cannot be shared or resold to any other third party. Disclosure to third parties, usage of data in a public document, article or blog by the customer can be done with prior permission taken from IndustryARC. For information regarding permissions and sales, contact: sales@industryarc.com | sanjay.matthews@industryarc.com
To Enquire About the Report Click Here IndustryARC +1 614 - 588 - 8538 sales@industryarc.com Copyright ©2015 IndustryARC All Rights Reserved. This document contains highly confidential information and is the sole property of IndustryARC. No part of it may be circulated, copied, quoted, or otherwise reproduced without the approval of IndustryARC.