Download
1 / 2
20 likes | 21 Views
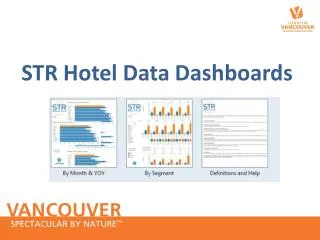
Aventior provides services in dashboard development, business intelligence, data warehouse design, big data & data lake implementation.

E N D
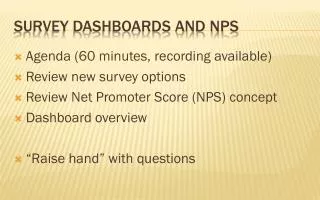
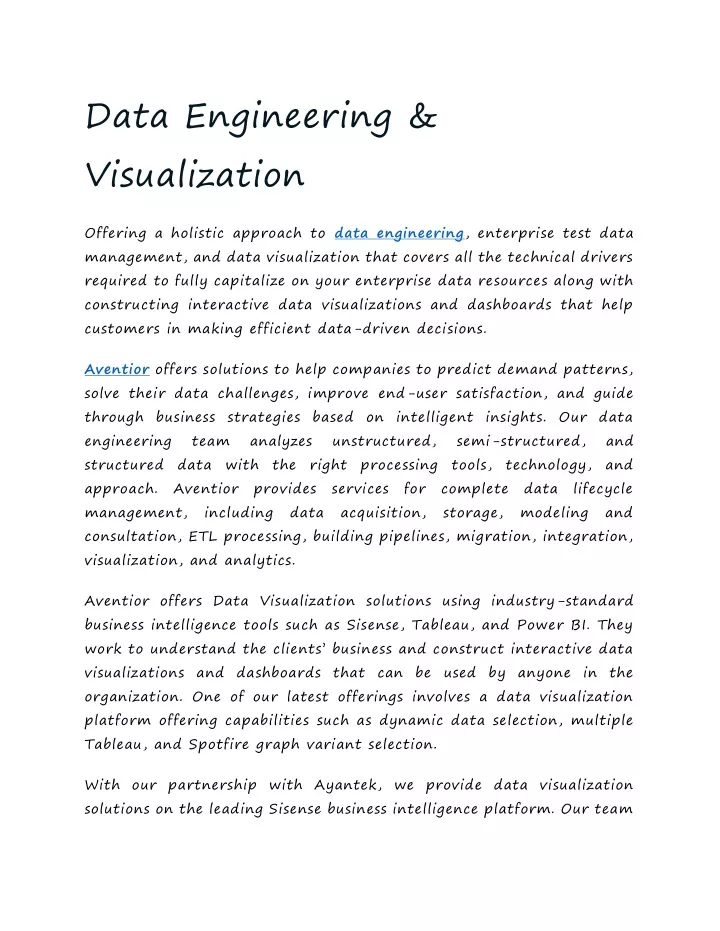
Data Engineering & Visualization Offering a holistic approach to data engineering, enterprise test data management, and data visualization that covers all the technical drivers required to fully capitalize on your enterprise data resources along with constructing interactive data visualizations and dashboards that help customers in making efficient data-driven decisions. Aventior offers solutions to help companies to predict demand patterns, solve their data challenges, improve end-user satisfaction, and guide through business strategies based on intelligent insights. Our data engineering structured data with the right processing tools, technology, and approach. Aventior provides services for complete data lifecycle management, including data acquisition, storage, modeling and consultation, ETL processing, building pipelines, migration, integration, visualization, and analytics. team analyzes unstructured, semi-structured, and Aventior offers Data Visualization solutions using industry-standard business intelligence tools such as Sisense, Tableau, and Power BI. They work to understand the clients’ business and construct interactive data visualizations and dashboards that can be used by anyone in the organization. One of our latest offerings involves a data visualization platform offering capabilities such as dynamic data selection, multiple Tableau, and Spotfire graph variant selection. With our partnership with Ayantek, we provide data visualization solutions on the leading Sisense business intelligence platform. Our team
also has expertise in providing business reporting, analytics, and data visualization using SAS and Tableau.