Download
1 / 32
320 likes | 463 Views
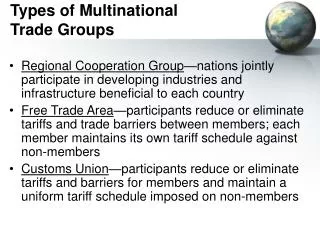
Multinational Market Regions and Market Groups. Multinational Market Regions and Market Groups. I. Patterns of Multinational Cooperation 1) Regional Cooperation Groups 2) Free Trade Area 3) Customs Union 4) Common Market 5) Political Union.

E N D
Multinational Market Regions and Market Groups
Multinational MarketRegions and Market Groups I. Patterns of Multinational Cooperation 1) Regional Cooperation Groups 2) Free Trade Area 3) Customs Union 4) Common Market 5) Political Union
The European Economic Area: EU, EFTA, and Associates ICELAND EU EFTA NORWAY SWEDEN EC Associated FINLAND ATLANTIC OCEAN Netherlands DENMARK UNITED KINGDOM IRELAND GERMANY BELGIUM Austria FRANCE Switz. ITALY Portugal SPAIN TURKEY MALTA GREECE
II. Europe 1) European Union a) Implications for European Firms - Lower transaction/transport costs - Economies of Scale in production - Gains from competition b) Free Expansion to Other European Markets - Access to > 370 million consumers - Flexible production - Harmonization of laws/standards
A Comparison of the EU and NAFTA Population GNP Imports** Exports** ($ millions)* (per capita)* ($ millions) ($ millions) 10-7 EU* 373.5 $ 8,180 1,899,466 1,927,914 NAFTA 387.4 8,061 1,014,211 852,536 * Includes 15 Countries. **Includes intra-member trade. SOURCES: “Indicators of Market Size for 115 Countries,” Crossborder Monitor, August 27, 1997; and International Marketing Data and Statistics, 1997 (London: Euromonitor, 1997). Irwin/McGraw-Hill
c) European Union Implications for U.S. Firms - Easier access to European markets - Potential growth in demand for U.S. products - Increased competition - Fears of “Fortress Europe” Marketing Mix Implications of EU 2) EFTA 3) CEFTA
EC Institutions European Commission Council of Ministries European Parliament European Court of Justice
Twelve republics, each with their own legislatures Twenty smaller “autonomous republic” or homelands for various ethnic groups Commonwealth of Independent States ARCTIC OCEAN BELARUS MOLDOVA 10-10 UKRAINE RUSSIAN REPUBLIC GEORGIA ARMENIA AZERBAIJAN KAZAKHSTAN UZBEKISTAN TURKMENISTAN KYRGYZSTAN TAJIKISTAN Irwin/McGraw-Hill
Central European Free-Trade Area (CEFTA) Poland Hungary Slovakia Czech Republic Slovenia Romania 10-11 Irwin/McGraw-Hill
North American Free-Trade Area (NAFTA) Canada 10-12 United States Mexico Irwin/McGraw-Hill
North American Free-Trade Area Provisions Market Access Non Tariff Barriers Rules of Origin Customs Administration Investment Services Intellectual Property Standards Government Procurement 10-13 Irwin/McGraw-Hill
NAFTA Rules of Origin Rule Type Description Tariff shift rule Non-NAFTA imports undergo sufficient manufacture or processing to become products that can qualify under a different tariff classification. Value-content rule A set percentage of the value of the good must be North American (usually coupled with a tariff classification shift requirement). Some goods are subject to the value-content rule only when they fail to pass the tariff classification test because of non-NAFTA inputs. 10-14 * A complete description of the rules of origin can be found at www.mac.doc.gov/nafta/menu1.htm (select NAFTA Rules of Origin and Customs Information). Irwin/McGraw-Hill
Southern Cone Free Trade Area (Mercosur) ArgentinaBolivia Brazil Chile Paraguay Uruguay 10-15 Irwin/McGraw-Hill
Latin American Integration Association (LAIA) Argentina Mexico Bolivia Paraguay Brazil Peru Chile Uruguay Columbia Venezuela Ecuador 10-16 Irwin/McGraw-Hill
Andean Common Market (ANCOM) Bolivia Columbia 10-17 Ecuador Peru Venezuela Panama (Assoc.) Irwin/McGraw-Hill
Caribbean Community and Common Market (CARICOM) AntiguaMontserrat BarbudaSt. Kitts-Nevis BelizeAnguilla Dominica St. Lucia GrenadaSt. Vincent GuyanaTrinidad-Tobago Jamaica 10-18 Irwin/McGraw-Hill
Central America Common Market (CACM) Guatemala 10-19 Costa Rica Nicaragua Honduras Irwin/McGraw-Hill
The Future • NAFTA • SAFTA ??? • FTAA ??? 10-20 Irwin/McGraw-Hill
Association of Southeast Asian Nations (ASEAN) Brunei Philippines Indonesia Singapore LaosThailand Malaysia Vietnam Myanmar 10-21 Irwin/McGraw-Hill
ASEAN + 3 • Brunei • Singapore • Indonesia • Thailand • Laos• Vietnam • Malaysia China • MyanmarJapan • Philippines South Korea 10-22 Irwin/McGraw-Hill
Comparison of Exports Among Members of APEC and the EC Population, 1989 Exports, 1990 Exports, 1995 GNP, 1996 (millions) (U.S. $ millions) (U.S. $ millions) (U.S. $ billions) APEC 2,235 732,869 770,097 22,952Americas* 406 306,486 311,085 7,989Asia 1812 399,455 419,901 6,447Oceania 22 26,928 34,111 343 EC 374 515,915 628,606 8,180 10-23 *includes: U.S., Canada, Mexico, and Chile. SOURCES: IMF: International Financial Statistics, Direction of Trade; OECD: National Account, EC Committee: “Indicators of Market Size for 115 Countries,” Crossborder Monitor, August 27, 1997; and International Marketing Data and Statistics. 1997 (London: Euromonitor, 1997). Irwin/McGraw-Hill
Economic Community of West African States (ECOWAS) Benin Liberia Burkina Faso Mali Cote d’ Ivoire Mauritania Gambia Niger Ghana Nigeria Guinea Guinea-Bissau 10-24 Irwin/McGraw-Hill
Southern African Development Community (SADC) Angola South Africa Botswana Swaziland Lesotho Tanzania Namibia Zambia Malawi Zimbabwe Mauritius Mozambique 10-25 Irwin/McGraw-Hill
Afro-Malagasy Economic Union ▶ Benin ▶ Gabon ▶ Burkina Faso ▶ Mali ▶ Cameroon ▶ Mauritania ▶ Central African Republic ▶ Niger ▶ Chad ▶ Senegal ▶ People’s Repub. of the Congo ▶ Togo ▶ Cote d’Ivoire 10-26 Irwin/McGraw-Hill
East African Customs Union ▶ Ethiopia ▶ Tanzania ▶ Kenya ▶ Uganda ▶ Sudan ▶ Zambia 10-27 Irwin/McGraw-Hill
Maghreb Economic Community ▶ Algeria ▶ Tunisia ▶ Libya ▶ Morocco 10-28 Irwin/McGraw-Hill
Economic Community of West African States (ECOWAS) ▶ Benin ▶ Guinea-Bissau ▶ Burkina Faso ▶ Liberia ▶ Cote d’Ivoire ▶ Mali ▶ Gambia ▶ Mauritania ▶ Ghana ▶ Niger ▶ Guinea ▶ Nigeria 10-29 Irwin/McGraw-Hill
West Africa Economic Community ● West Africa Economic Community ▶ Senegal ▶ Mali ▶ Togo ▶ Mauritania ▶ Burkina Faso ▶ Niger ▶ Cote d’Ivoire ● Customs and Economic Union of Central Africa (CEUCA) ▶ Cameroon ▶ P. Rep. Of Congo ▶ C. Africa Repub. ▶ Gabon 10-30 Irwin/McGraw-Hill
Customs and Economic Union of Central Africa (CEUCA) ▶ Cameroon ▶ P. Rep. Of Congo ▶ C. Africa Repub. ▶ Gabon 10-31 Irwin/McGraw-Hill
Arab Common Market Iraq Kuwait 10-32 Jordan Syria Egypt Irwin/McGraw-Hill
Economic Cooperation Organization (ECO) Pakistan Iran 10-33 Turkey Azerbaijan Turkmenistan Uzbekistan Irwin/McGraw-Hill
Future Multinational Trade Groups United States/Japan Hong Kong/Taiwan/China Asia-Pacific Rim Countries Hong Kong/Taiwan/Coastal Provinces of Southern China Western Hemisphere Free Trade Area Transatlantic Free Trade Area (United States and European Union) 10-34 Irwin/McGraw-Hill


![Heat Exchanger Market By Regions]: Market size & Forecast, 2018 – 2026](https://cdn5.slideserve.com/10186310/heat-exchanger-market-set-to-exceed-33-01-billion-by-2026-cagr-6-9-dt.jpg)