Download
1 / 8
80 likes | 373 Views
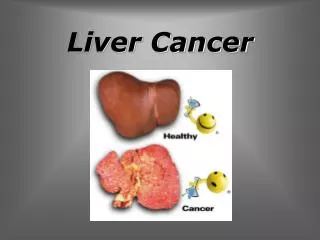
[2]. Introduction. Thailand has a high burden of liver cancer, which appears to have increased substantially in the past 10 years. During 1996-2006, 24% of cancer deaths were assigned as liver cancer with ICD-10 coding as C22. Liver cancer was the fourth leading cause of death for males and the fif

E N D
1. Trend and Levels of Liver Cancer Mortality in the Upper Northeastern of Thailand: A Case Study of Using Google Earth in Public Health Patarapan Odton1
Prof. Don McNeil2 and Asst. Prof. Dr. Chamnein Choonpradub2
1 International Health Policy Program, Ministry of Public Health, Thailand
2Department of Mathematics and Computer Science, Faculty of Science and Technology,
Prince of Songkla University, Thailand
2. [2] Introduction Thailand has a high burden of liver cancer, which appears to have increased substantially in the past 10 years. During 1996-2006, 24% of cancer deaths were assigned as liver cancer with ICD-10 coding as C22.
Liver cancer was the fourth leading cause of death for males and the fifth for females in the national burden of disease studies for 1999[1] and 2004 [2].
Liver cancer mortality varies over the regions in Thailand. An analysis of mortality in the Thai population during 2001-2005[3] found that residents in the north-east region had higher liver cancer mortality than other residents.
There were 88,532 deaths due to liver cancer during 1996-2004 in Thailand, with 81.6% outside hospital. The sixth Public Health Area, containing Nong-Bua-Lam-Phu, Khon-Kaen, Udon-Thani, Loei, Nong-Khai, Kalasin and Sakon-Nakhon province, accounted for 26.1% of all deaths in the country during 1996-2006.
3. [3] Objectives Objectives:
To investigate the demographic, temporal, and spatial variation of Liver cancer mortality in the upper north-eastern region of Thailand (Public Health Area 6).
To develop a visualization tool for displaying the statistical analysis of liver cancer mortality.
4. [4] Methodology Data sources:
The 26,640 liver cancer deaths (ICD10: C22) occurring outside hospital in the PHA6 of Thailand from the vital registration database were aggregated by sex, age group (30-44, 45-59, 60-74, 75+), year, and super-district.
Population by gender, age group, and district ? 2000 population and housing census (National Statistical Office, Thailand)
Methods
We analyzed the mortality rates in aggregated districts called �super-districts�, defined as regions comprising contiguous districts in the same province with a total population of at least 200,000. We thus obtained 25 super-districts for PHA6.
Poisson generalized linear model
Model for mean mortality rate per 100,000 populations:
are the combinations of age-group and years (44 levels)
are the combinations of gender and regions (50 levels)
5. [5] Table 1: Analysis of variance for Poisson model of liver cancer morality rates The combination factors between age-group and years, and gender and regions are significant.
6. [6] Figure 1: Plots of 95% confidence intervals for comparing liver cancer mortality trends Figure 1 shows the time series plots of liver cancer mortality in four age groups after adjusted for gender and region. The residents aged less than 45 years had lower mortality rates than the others. Liver cancer mortality rates in aged 60 and over had increased rapidly during the years 1997-2003.
7. [7] Figure 2: Plots of 95% confidence intervals of liver cancer mortality rates by gender and region adjusted for age-group and year. The overall mean was 72 per 100,000 indicated by the horizontal red line. Every super-district in Sakon-Nakhon had significantly higher mortality than the average for both sexes. Super-districts in Loei province had lower mortality than the average. All super-districts in Khon-Kaen had lower mortality than the average, except the super-district containing BanFang, PhraYun, NongRua, ManchaKhiri, KhokPhoChai, and BanHaet districts.
8. [8] Figure 3: Liver cancer morality map for residents in the upper north-eastern of Thailand
9. [9] Conclusions There was a significant difference in liver cancer mortality across 25 super-districts in the upper north-eastern region of Thailand.
Poisson regression model with demographic, region, and time as factors provided a reasonable fit to liver cancer mortality in the region of interest.
The differences of liver cancer mortality rates across super-districts reflect underlying factors that justify further studies. Potential factors valuable of investigation are risk behavioral patterns, level of health resources, and social determinants of health.
The combination of Google Earth and an open statistical package like R provide an inexpensive functional tool for analysis and visualization for public health research. Appropriate graphs and maps developed from the statistical results provide useful tools for assessing the geographical variations of cause-specific mortality over the study area.