Download
1 / 39
400 likes | 754 Views
Security Attribute Evaluation Method: A Cost Benefit Analysis. Shawn A. Butler Computer Science Department Carnegie Mellon University 9 November 2001. M. S. We always seem to need more security! Don’t we have enough?.

E N D
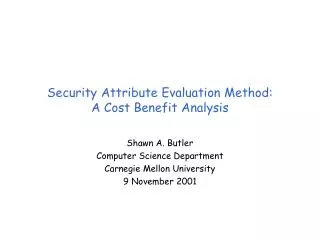
Security Attribute Evaluation Method: A Cost Benefit Analysis Shawn A. Butler Computer Science Department Carnegie Mellon University 9 November 2001
M S We always seem to need more security! Don’t we have enough? Hey Boss, we need more security. I think we should get the new Acme 2000 Hacker Abolisher
M S What are my alternatives? Trust me, we will be more secure! What is it going to cost? What is the added value?
Alternatives? Value? S
Problem • Security managers lack structured cost-benefit methods to evaluate and compare alternative security solutions.
System Design Available Countermeasures Threats Security Components Prioritized Risks Select Countermeasures Risk Assessment Requirements Policies Outcomes Security Architecture Development Process Develop Security Architecture Security Architecture
System Design Available Countermeasures Threats Security Components Prioritized Risks Select Countermeasures Develop Security Architecture Risk Assessment Requirements Policies Outcomes Security Architecture Security Architecture Development Process
Threats Prioritized Risks Risk Assessment Outcomes The Multi Attribute Risk Assessment • Determine threats and outcomes • Assess outcome attribute values • Assess weights • Compute threat indices • Sensitivity Analysis
Threats Scanning Procedural Violation Browsing Distributed Denial of Service Password Nabbing Personal Abuse Signal Interception : : 29 Threats Outcome Attributes Lost Productivity Lost Revenue Regulatory Penalties Reputation Lives Lost Lawsuits : : Oi = (Lost Prod, Lost Rev, Reg Penalties, Reputation) Determine Threats and Outcomes
Weight (wi) Order Rank 1 .42 .08 .17 .33 100 20 40 80 Prioritize and Assess Weights(Swing Weight Method) Worst Best Lost Prod Lost Rev Reg Penal Reputation 240 hrs $12,000 3 4 0 hrs $0 0 0 4 3 2
So determine Value Functions Vj(xj) 1 1 1 1 0 0 3 12,000 0 0 240 4 P: Lost Productivity 0 0 0 0 G: Regulatory Penalties L: Lost Revenue R: Reputation Compute Threat Indices Hours + $$ + Reputation + Regulatory Penalties = ? Nonsense ! L(x1) $$ + P(x2)Hours + R(x3)Reputation + G(x4)Regulatory Penalties = TI
Expected threat pexpected (j=attributesWj Vj(xj expected)) Threat index TIa = Freqa[ plow (j=attributesWj Vj(xj low)) + pexpected (j=attributesWj Vj(xj expected)) + phigh(j=attributesWj Vj(xj high)) ] Computing the Threat Index
Scanning in More Detail .01 = plow (j=attributesWj Vj(xj low)) .07 = pexpected (j=attributesWj Vj(xj expected)) .00 = phigh (j=attributesWj Vj(xj high)) 10,220 (.01 +.07 +.00) 886.57
Risk Assessment Sensitivity Analysis • Attack Frequencies • Outcome Attribute Values • Attribute Weights
Probability Distributions Scanning Frequency Dist Scanning Reputation Dist
0.160 Mean=11.004 Mean=11.004 0.140 0.120 0.100 Prob Density 0.080 0.060 0.040 0.020 0.000 0 0 10 10 20 20 30 30 Rank 5% 90% 5% 6 25 Cryptographic Compromise Distribution
Compromise / Low/L45 Alteration / Low/F37 .075 -.063 Denial of Service / Anti-S.../Y49 Logic Bomb / FREQ/year/B24 .061 Trojan Horse / Low/F44 .057 Procedural Violation / Bio.../AR35 .054 -.053 Scanning / URL Block/AA34 Message Stream Mod / Crypt.../AE48 .048 -.048 Logic Bomb / Auditing/AU55 Procedural Violation / e-S.../AO35 .046 Passwrod Nabbing / Line En.../AB46 .046 Personal Abuse / Low/F52 .046 Trap Door / Auditing/AU47 .045 Std b Coefficients Regression Sensitivity -.639 Reputation Outcome -.213 Reputation/wj Lost Productivity/K30 .19 .078 -1 -0.75 -0.5 -0.25 0 0.25 0.5 0.75 1
Sensitivity Analysis • How sensitive are the answers to estimation errors? • Does it matter if the estimates are not accurate? • How accurate do they have to be before the decision changes? • When is it important to gather additional information?
System Design Available Countermeasures Security Components Select Countermeasures Requirements Policies Security Architecture Selecting Countermeasures Threats Prioritized Risks Develop Security Architecture Risk Assessment Outcomes
Security Attribute Evaluation Method (SAEM) What is SAEM? A structured cost-benefit analysis technique for evaluating and selecting alternative security designs Why SAEM? Security managers make explicit their assumptions Decision rationale is captured Sensitivity analysis shows how assumptions affect design decisions Design decisions are re-evaluated consistently when assumptions change Stakeholders see whether their investment is consistent with risk expectations
System Design Available Countermeasures Security Components Select Countermeasures Policies Requirements SAEM Process • Evaluation Method • Assess security technology benefits • Evaluate security technology benefits • Assess coverage • Analyze Costs Prioritized Risks
Effectiveness Percentages Security Tech Auth Policy Serv Virtual Priv Net Hardened OS Net Monitors Prxy Firewall Vuln Assess PF Firewall Host IDS Net IDS Auditing Threat Assess Security Technology Benefits
Evaluate Security Technology Benefits Security Tech Auth Policy Serv Virtual Priv Net Hardened OS Net Monitors Prxy Firewall Vuln Assess PF Firewall Host IDS Net IDS Auditing Threat
Analyze Costs 589 Host IDS Net IDS Auditing Threat Index Auth Policy Server Smart Cards Single Sign-on PKI Cert 0 $20,000 $0 Purchase Cost
SAEM Sensitivity Analysis The vulnerability Assessment tool is 66% effective. What does that really mean?
Security Technology Effects on the Risk Assessment • Benefit Estimates: • Reduce Frequency • Change Outcomes Vulnerability Assess Scanner Benefit Distribution
Outcome ChangesProcedural Violations Reputation After Before
Preliminary Results • Risk Assessment threat indices reflect security manager’s concerns • based on interviews and feedback • Security managers are able to estimate technology benefits • based on experience, organizational skill levels, and threat expectations • Sensitivity Analysis is key to method • based on uncertainty of assumptions