Download
1 / 23
290 likes | 1.43k Views
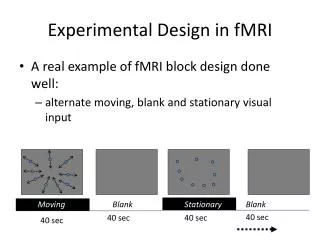
Experimental Design and Modeling in Aquaculture. School of Marine and Coastal Sciences, Quelimane , Mz. We will cover this morning. What is a scientist? What is the scientific method? How to design and execute an experiment. How to develop a simple model.

E N D
Experimental Design and Modeling in Aquaculture School of Marine and Coastal Sciences, Quelimane, Mz
We will cover this morning • What is a scientist? • What is the scientific method? • How to design and execute an experiment. • How to develop a simple model. • Example of a teaching model – Fish Farm.
A scientist – Someone who uses the scientific method to solve problems. • So what is the scientific method? • Formulate a question. • Design an experiment to answer question. • Carry out the experiment and collect the data. • Analyze the data. • Evaluate and verify hypothesis. Correct or incorrect.
Science is like climbing a mountain. Only one way leads to the top. The other is blocked by cliffs, glaciers, and rock walls. How to find the way?
Don’t conquer the world in one step! • If you try the hard way to climb the cliff you will never make it to the top. You will fall and have accomplished nothing. • This is like a poorly designed experiment. You have achieved nothing and your experiment was a failure.
Look for the easy way! • Well designed experiments will take you one step at a time to the top. Each experiment must be strong to serve as a foundation for the next step. If you fall from one step, you make corrections, retry and make it to the next step.
How do we find the easy way? • Experimental Design! Don’t attack the mountain without thinking. It is bigger and stronger than you are. But you have a brain! • Use the scientific method – one step at a time
Data Collection and Monitoring • This is a necessary part of understanding the world. It is very important. • It is NOT science until it is analyzed using the scientific method. • There is much data in Quelimane suitable for analysis leading to an advanced degree which is being ignored. Climb the mountain the easy way!
Parts of an experiment • Develop question or hypothesis – Scientist • Design experimental methodology – Scientist • Collect data – Technician • Analyze data – Scientist • Evaluate hypothesis and verify – Scientist Did you know that Albert Einstein never collected data and did all his experiments in his mind?
Design your Experiment with careData collection must be relevant to your experiment. Why are you collecting the data?Analyze the data carefully using appropriate statistical methods
Example of A well designed experiment Hypothesis Increasing salinity decreases the growth rate of Tilapia, Oreochromismossambicus,
Experimental design • Aquaria of 8 different salinities 0 to 40 ppt • 10 fish in each aquarium under identical conditions. Measured and identified. • Salinity, oxygen, temp and pH recorded daily • All mortalities measured and recorded • Maximum food provided for several weeks. • Aquaria cleaned and water replaced daily. • All surviving fish measured and qualitatively assessed (condition, color etc.). • Repeat at least three times.
Analysis • Data table of salinity vrssize, oxygen vrs size, pH vrs size and temp vrs size for 80 fish. • Linear regression size against all variables • Calculate correlation coefficients for all. • Analysis of Variance with 95% statistical probability. • Data tables provided of number, means, variation, standard deviation and statistical results.
Conclusion • Based upon the analysis of data, accept or reject your original hypothesis. • Regardless of the outcome if the experiment is well done you have made one step up the mountain. Design a new experiment and take another step.
Modeling can • Save time and money • Avoid mistakes • Predict the future • Provide insight into interactions not obvious • Assist is the design of experiments and equipment • BUT they must be supported by experimental work. Models are only as good as the data!