Download
1 / 36
360 likes | 554 Views
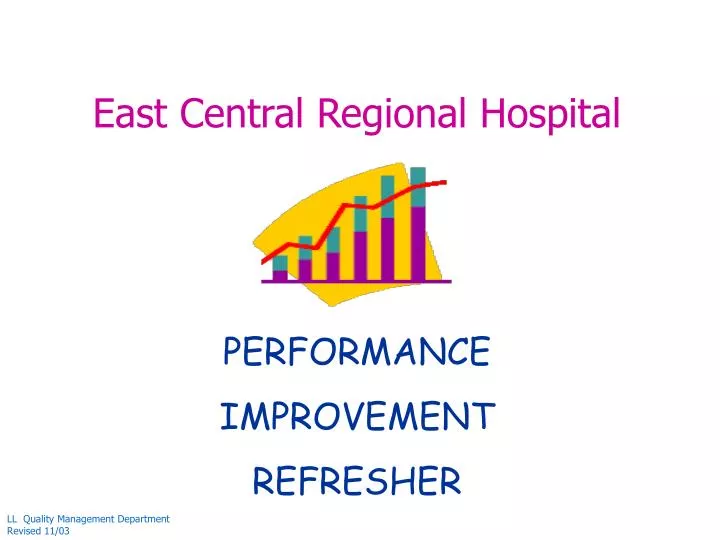
East Central Regional Hospital PERFORMANCE IMPROVEMENT REFRESHER. LL Quality Management Department Revised 11/03. This is a Typical Organizational Direction !. ?. ?. This is the Preferred Organizational Direction !. East Central Regional Hospital. Our Mission

E N D
East Central Regional Hospital PERFORMANCE IMPROVEMENT REFRESHER LL Quality Management Department Revised 11/03
This is a Typical Organizational Direction ! ? ?
This is the Preferred Organizational Direction !
East Central Regional Hospital Our Mission To provide quality mental health/developmental disabilities care and treatment to our consumers
East Central Regional Hospital Our Vision To use resources, creativity, and innovation to become a CENTER OF EXCELLENCE.
Performance Improvement is a continuous effort of assessment, evaluation and adaptation by an organization to improve the outcome of services, processes and functions.
Performance Improvement is every employee’s concern! No matter what your job, you play an important role in helping provide quality patient care. Performance Improvement is on-going! Being committed to quality doesn’t mean reaching a goal, then quitting. Even when something is working well, there is room for improvement.
Performance Improvement Tools Brainstorming Affinity Diagram Cause and Effect Diagram (“Fishbone”) Flow Chart Checksheets Line Graph Pareto Chart Histograms
Performance Improvement Tools (These are Qualitative Tools which focus on data describing consumers, occurrences & conditions) Tools for generating ideas, setting priorities, providing direction, understanding root causes, and helping to understand processes: Brainstorming Affinity Diagram Cause and Effect Diagram (“Fishbone”) Flow Chart ,
Brainstorming What is Brainstorming ? A tool used by teams for creative exploration of options in an environment free of criticism. Benefits of Brainstorming • Creativity • Large Number of Ideas • All team members involved • Sense of ownership in decisions • Input to other Tools Brainstorming Ground Rules • Active participation by everyone • No discussion • Build on others’ ideas • Display ideas as presented • Set a time limit • Clarify and combine
Display Ideas Sort Ideas into Related Groups Drawing Finished Affinity Superheader Header Header Header Idea Idea Idea Idea Idea Idea Idea Idea Idea What Is An Affinity Diagram? A tool that gathers lots of “language data”, like ideas and opinions and then sorts and groups the related ideas. LL- QM DEPT.
Methods Environment Effect People Equipment What Is A Cause and Effect Diagram ? (“Fishbone Diagram”) A tool that helps identify, sort, and display possible causes of a problem in a process. • Benefits of Using a Cause and Effect Diagram: • Encourages group participation • Uses an orderly, easy-to-read format • Increases knowledge of what is happening in the process
Cause & Effect Diagram EXAMPLE: Why are employees late for work? Methods Environment caught by train Tried a new route Raining hard Forgot to set clock Late for Work Dog needed walking Out of gas car wouldn’t start Son misplaced books People Equipment LL QM Dept.
What Is A Flow Chart? A diagram that uses graphic symbols to show the nature and flow of steps in a process. • Benefits of Using a Flow Chart: • Promote process understanding • Provide a tool for training • Identify problem areas and improvement opportunities Symbols Used in Flowcharts Start/End Decision No Process Step Yes M Connector Measurement
Performance Improvement Tools (These are Quantitative Tools and focus on specific measurement units) Statistical Tools used for measuring performance, collecting and displaying data, and monitoring performance over time: Check Sheets Line Graph Pareto Chart Histograms
Turn-around time 1-5 min 6-10 min 11-15 min 16-20 min 25 20 TIME (Minutes) 15 10 5 0 8 9 10 11 12 1 2 3 Time of Day CHECKSHEETS Record data for further analysis, provide a historical analysis and introduce data collection methods. Dwl 11/03
What Is A Line Graph? A line graph that shows results of a process over time. • Why Use Line Graphs? • Analyze and check the data for patterns • Monitor process performance • Communicate process performance (The chart above is an example only, not an actual representation of restrictive procedures used)
What Is A Pareto Chart? A graph using a set of bars to show how often a problem occurs. • Why use a Pareto Chart? • Breaks big problems into smaller pieces • Identifies most significant factors • Shows where to focus efforts and improvement opportunities • Allows better use of limited resources (The chart above is an example only, not an actual representation of reasons for re-admissions)
What Is A Histogram? A bar chart that shows the distribution of data. It’s like a “snapshot” of the process. • When are Histograms used? • To summarize large data sets in a picture form • Compare measurements to expectations • Communicate information to the team • Assist in decision making (The chart above is an example only, not an actual representation of appointment wait times)
What Is Data Collection? Data Collection is obtaining useful information. The issue is not:How do we collect data? It is:How do we obtain useful data? Why Collect Data? To establish a factual basis for making decisions “I think the problem is……….” becomes “The data indicate the problem is…..”
Find a process to improve Organize a team that knows the process Clarify current knowledge of the process Understand causes of process variation Select the process improvement PLAN ACT • Improvement • Data Collection • To hold gain • To continue • improvement FOCUS-PDCAPerformance Improvement Model DO CHECK • Improvement • Data Collection • Data Analysis • Data for process • improvement Examples of Quality in a Hospital Setting JCAHO 1992
Find A Process to Improve ThinK: High Volume? High Risk? Problem Prone? Externally mandated? Who will benefit from the process improvement? How does it fit the mission?
Organize a Team that knows the process ThinK: Does the team include members who do the work & know the process ?
Clarify Current Knowledge of the Process ThinK: What are the things that contribute to the process not working the way we expect it will? Is this the actual flow of the process or the perceived flow? Perceived Actual ? ? ?
Understand Causes of Process Variation ThinK: Can we use the data collected to determine specific, measurable and controllable variations?
Select the Process Improvement ThinK: What changes can be made to improve the process? Can we test the changes in a pilot project?
Plan the improvement and continued data collection. ThinK: How do we make the changes that were selected as possible solutions and what are our goals and targets and how can we reach them?
Do the improvement, data collection and analysis ThinK: As we begin the process improvement are we getting the results/outcomes we expected? Are there any surprises?
Check and study the results ThinK: If there were surprises or unexpected outcomes, can we do anything about them? Has the process improvement been successful, or will it be necessary to modify the change?
Act to hold the gain and continue to improve the process. ThinK: How will the improvement be implemented beyond the pilot, if one was used, and can the team find another potential improvement within the process? Are we prepared to return to “Plan” or earlier steps in the FOCUS-PDCA if needed?
Find a process to improve Organize a team that knows the process Clarify current knowledge of the process Understand causes of process variation Select the process improvement PLAN ACT • Improvement • Data Collection • To hold gain • To continue • improvement FOCUS-PDCAPerformance Improvement Model If necessary, you can start the FOCUS-PDCA again! DO CHECK • Improvement • Data Collection • Data Analysis • Data for process • improvement Examples of Quality in a Hospital Setting JCAHO 1992
East Central Regional Hospital Working together to improve Services, Safety and Quality of Care for all our consumers!