Download
1 / 35
390 likes | 1.12k Views
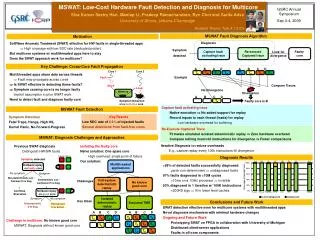
Chiller Fault Detection and Diagnosis (FDD). Paul Riemer June 20, 2000 ECE/CS/ME 539 Semester Project Instructor: Prof. Y.H. Hu (a little piece of my MS research project). What is FDD?.

E N D
Chiller Fault Detectionand Diagnosis (FDD) Paul Riemer June 20, 2000 ECE/CS/ME 539 Semester Project Instructor: Prof. Y.H. Hu (a little piece of my MS research project)
What is FDD? A process of comparing quantities that characterize a system’s actual performance against their baseline values to determine deviation from accepted behavior and to identify which of the system’s components are responsible and how so.
Large Scale Air Conditioning Equipment Cools Water To Be Piped Around Building Vapor Compression Cycle Uses Refrigerant such as CFC, HCFC, NH3 Large Energy Demands: Mostly Electrical Compressor (Centrifugal, Reciprocal, Screw, Scroll) Water Pumps Chiller Basics
Chiller Schematic Cooling Tower Condenser (Shell and Tube HX) 2 3 Expansion Device Centrifugal Compressor 1 4 Evaporator (Shell and Tube HX) Air Handlers
& Independent Dependent GPMCW TCWS TCWR Condenser TCOND T2 POWER Expansion Device Centrifugal Compressor Evaporator TEVAP TCHWS TCHWR GPMCHW
Independent Monitored Quantities • GPMCHW - Chilled Water Flow Rate • TCHWS - Chilled Water Supply Temp • TCHWR - Chilled Water Return Temp • GPMCW - Condenser Water Flow Rate • TCWS - Condenser Water Supply Temp (a.k.a. Forcing Inputs)
Dependent Monitored Quantities • TCWR - Condenser Water Return Temp • TCOND - Condenser Saturation Temp • TEVAP - Evaporator Saturation Temp • T2 - Compressor Exiting Temp • Power - Electric Power Draw
Characteristic Quantities (CQs) Evaporator • Heat Transfer • UA • Approach TCHWS-TEVAP • CHWDT TCHWR - TCHWS Condenser • Heat Transfer • UA • Approach TCOND-TCWR • CWDT TCWR - TCWS Others • Isentropic Efficiency • Motor Efficiency • COP
FDD Process 1 Neural Network Predictor Data Reduction Code Predicted CQs No Fault! Fault Classifier Forcing Inputs Dependent Quantities Fault X! Data Reduction Code Physical Chiller Actual CQs Remedy?
FDD Process 2 Neural Network Predictor Predicted CQs No Fault! Fault Classifier Forcing Inputs Dependent Quantities Fault X! Data Reduction Code Physical Chiller Actual CQs Remedy?
} } =No Fault =Fault X Fault Classifier & End Goal • Compare actual and predicted CQs • Comparison criteria from a detail thermodynamic model of a chiller Actual CQ1 2% Above Predicted CQ1 Actual CQ2 5% Below Predicted CQ2 Actual CQ1 15% Above Predicted CQ1 Actual CQ2 10% Below Predicted CQ2
Neural Network Predictor • All Approaches • 5 Independent Quantities as Inputs • Feed Forward Multi-layer Perceptron • Created and Trained using Matlab Toolbox • Linear Activation Function • Fault Free Data Set - April
Neural Network Predictor • FDD Process 1 • 5 Dependent Quantities as Outputs • Approach 1 - 1 Network w/5 Outputs • Approach 2 - 5 Networks each w/1 Output • FDD Process 2 • Approach 3 • 1 Network w/11 CQ’s as Outputs
Data, Valuable Data • Available • 4 identical chillers for cooling season • 10 monitored quantities on 1-minute interval • Utilization • Trimmed non-operating data • Trimmed to expand interval between points • April as fault free training and testing data • July as potential faulty data for FDD
Results • Approach 1 = Run 34 • Approach 2 = Runs 51-55 • Approach 3 = Run 74 • Part 1 • Approaches 1 & 2 and Actual Values • Plots of 5 Dependent Quantities
Results Continued • Approaches 1 & 2 not significantly different • Approach 1 results converted to CQ’s by EES data reduction code • Part 2 • Approaches 1 & 3’s CQ’s vs actual values • Plots of 11 CQ’s
Conclusions • Approaches 1 & 3 quite similar • Training Set Predictions (April Data) • Good Matches: QEVAP, DTCHW, QCOND, DTCW • So-so Matches: APPREVAP, UAEVAP, NISEN, NMOTOR, COP • Bad Matches: APPRCOND, UACOND
Conclusions Continued • Actual FDD Predictions (July Data) • Acceptable: QEVAP, DTCHW, QCOND, DTCW, UAEVAP, APPREVAP, • Irrelevant: UACOND, APPREVAP • (recall training set prediction not acceptable) • Interesting and worth further study: • NISEN - decreased compressor efficiency? • NMOTOR - increased motor efficiency? • COP - increased overall performance?
End Notes and Beyond • Three approaches performed equally well on April Training Data • Prediction worked on about half of CQ’s • Future work as part of thesis project • Modify Network Configurations • Utilize More Data • Training • FDD Prediction