Download
1 / 14
150 likes | 576 Views
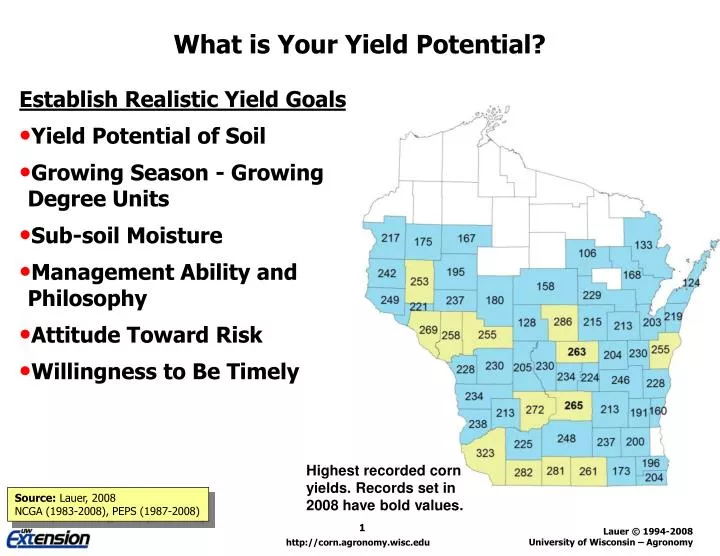
What is Your Yield Potential? Establish Realistic Yield Goals Yield Potential of Soil Growing Season - Growing Degree Units Sub-soil Moisture Management Ability and Philosophy Attitude Toward Risk Willingness to Be Timely Highest recorded corn yields. Records set in 2008 have bold values.

E N D
What is Your Yield Potential? Establish Realistic Yield Goals • Yield Potential of Soil • Growing Season - Growing Degree Units • Sub-soil Moisture • Management Ability and Philosophy • Attitude Toward Risk • Willingness to Be Timely Highest recorded corn yields. Records set in 2008 have bold values. Source: Lauer, 2008NCGA (1983-2008), PEPS (1987-2008)
PEPS Objectives, Divisions and Districts Objectives • Cost analysis of grain enterprises • Emphasize soil and water conservation, efficiency, profitability, and competitiveness vs. productivity alone • Recognize the way efficient growers integrate practices into a system through: • PEPS Contest • PEPS Workshops Divisions • Corn, Cash Crop: Corn following a legume or non-legume grain crop (i.e. corn, soybean, small grain, etc.) or non-legume forage or cover crops • No manure applied. • A charge for drying costs assessed. • Corn, Livestock: Corn following forage legume or green-manure legumes (alfalfa, red clover, etc.); and/or manure applied on land. • Drying costs will not be assessed. • Corn silage • Soybean Districts
Calculating Grower Return Partial Budget Analysis • Corn Price per bushel • Price matrix: $2.00, $4.00, $6.00 • grPEPS: Weighted Price per bushel = 50% November Average Cash price + 25% March CBOT Futures ($0.15 basis) + 25% July CBOT Futures ($0.10 basis) • November Average Cash price derived from WI Ag Statistics; CBOT Futures prices derived from closing price on first business day in December. • Grower return = (Yield x Price) - Input costs- Handling ($0.02 per bushel) - Hauling ($0.04 per bushel) - Trucking (system rate)- Drying (system rate per bushel-point > 15.5%) - Storage (system rate per 30 day) • Marketing plan: 50% sold at harvest, 25% at 4 months, and 25% at 8 months. • Corn Production Systems • Livestock: drying=$0.00, trucking=$0.00, storage=$0.01 • On-farm: drying=$0.02, trucking=$0.11, storage=$0.02 • Commercial: drying=$0.04, trucking=$0.11, storage=$0.03
Pricing Corn SilageLinn (Minnesota) Silage value ($/T) = Base price + Starch adjustment + NDFD adjustment • Base price = Cost of production • $60 per DM Ton • Starch adjustment = (starch% – 29%) x (0.5 bu/starch) x (corn price $/bu) • 29% = average starch content of corn derived from Dairyland Labs • 0.5 bu/T = 1% change in starch content • NDFD adjustment = (NDFD%) x (0.6 lb milk/NDFD) x (milk price $/lb) • 0.6 lb milk = 1% NDFD derived from Allen (48-hr digestion)
Differences between the High (20%) and Low (20%) profit groups Source: Lauer (1987-2007)
How much does it cost to produce corn in WI? Source: Lauer
How much does it cost to produce corn in WI? Source: Lauer
Corn and Soybean Cost of Production and Grower Return Source: Lauer
1 3 2 4 5 Corn and Soybean Cost of Production ($/A) Source: Lauer (2003-2007)
Average corn production costs for major inputs Source: Lauer
PEPS Contest Strengths and Weaknesses PEPS Contest does not account for: • Overhead • Usually assessed at 18 to 46 % of production costs • Examples include: • Plowing snow • Fixing fence • Property taxes / “Real” land costs • Equipping shop • Alimony • Farm pick-up • Tiling • Desk management • “Best of the Best” – Low yielding fields not usually entered • Verified yields and production costs • History • Comparative • Since 1997, placing based on profitability • Prior to 1997, placing based on lowest cost per bushel • Soil loss within tolerable “T” level • USLE; USDA-NRCS • Entry fee = $25, no limit to number of entries • Entry deadline = August 1 • Awards = $100 to winner for each district/division • Total fields evaluated = 2340
How can you get involved in PEPS? • Contest versus Verification options • Does it pay to grow corn on my farm? • Do I know my production costs? • If I do, how do I compare? • How efficient is my operation? • Am I a good steward? • If I make changes, how does that affect my bottom-line? • What role can agents/dealers/consultants play in PEPS? • Promote among producers who would benefit (helping with forms, soil loss and yield checks) • Encourage National Corn Growers Association yield contestants to enter • Provide input to PEPS committee from “real world” • Financial sponsorship
Know Your Production CostsChanges in Grower Return With PEPS Participation Source: Lauer (PEPS, 1987-2003, n= 128)