Download
1 / 1
10 likes | 349 Views
2.95. 0%. 50%. 100%. 2.30. 1.45. 1.95. 1.70. 1.65. URBAN CONGESTION REPORT October 2004. EXECUTIVE SUMMARY. New 12-mo. LOs. New 12-mo. LOs. New 12-mo. HIs. New 12-mo. LOs. New 12-mo. HIs. New 12-mo. HIs. 0. 0. 1. 0. 3. 2. 24. 2.20. 1.85. 44. 1.70. 2.52.

E N D
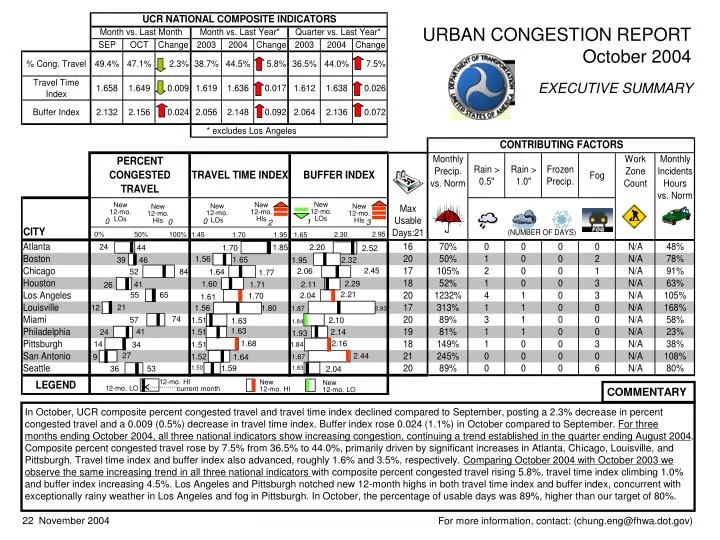
2.95 0% 50% 100% 2.30 1.45 1.95 1.70 1.65 URBAN CONGESTION REPORT October 2004 EXECUTIVE SUMMARY New 12-mo. LOs New 12-mo. LOs New 12-mo. HIs New 12-mo. LOs New 12-mo. HIs New 12-mo. HIs 0 0 1 0 3 2 24 2.20 1.85 44 1.70 2.52 1.56 1.65 39 46 2.32 1.95 2.45 2.06 52 84 1.64 1.77 2.29 1.60 41 2.11 1.71 26 2.21 55 65 2.04 1.70 1.61 21 12 1.56 1.80 1.87 2.83 74 57 1.51 2.10 1.63 1.84 1.63 41 1.51 24 2.14 1.93 1.68 2.16 14 34 1.51 1.84 27 2.44 1.52 9 1.64 1.87 1.59 36 53 1.50 1.83 2.04 12-mo. HI New 12-mo. HI New 12-mo. LO 12-mo. LO current month COMMENTARY In October, UCR composite percent congested travel and travel time index declined compared to September, posting a 2.3% decrease in percent congested travel and a 0.009 (0.5%) decrease in travel time index. Buffer index rose 0.024 (1.1%) in October compared to September. For three months ending October 2004, all three national indicators show increasing congestion, continuing a trend established in the quarter ending August 2004. Composite percent congested travel rose by 7.5% from 36.5% to 44.0%, primarily driven by significant increases in Atlanta, Chicago, Louisville, and Pittsburgh. Travel time index and buffer index also advanced, roughly 1.6% and 3.5%, respectively. Comparing October 2004 with October 2003 we observe the same increasing trend in all three national indicators with composite percent congested travel rising 5.8%, travel time index climbing 1.0% and buffer index increasing 4.5%. Los Angeles and Pittsburgh notched new 12-month highs in both travel time index and buffer index, concurrent with exceptionally rainy weather in Los Angeles and fog in Pittsburgh. In October, the percentage of usable days was 89%, higher than our target of 80%. 22 November 2004 For more information, contact: (chung.eng@fhwa.dot.gov)