Download
1 / 17
170 likes | 544 Views
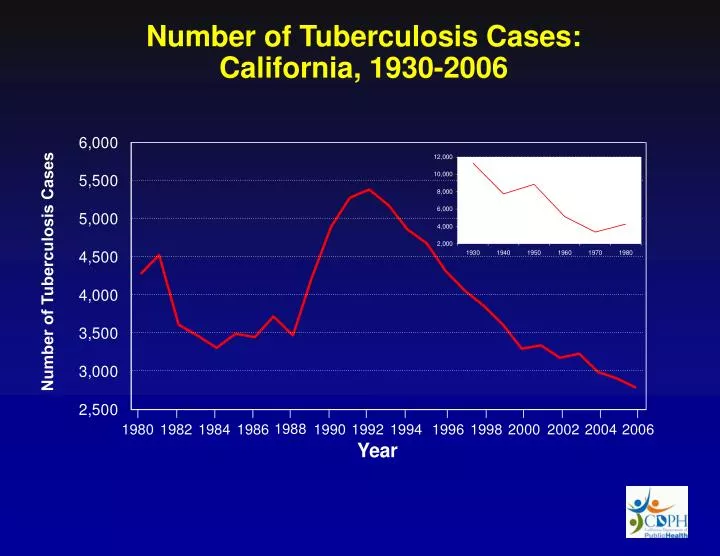
1988. 1980. 1982. 1984. 1986. 1990. 1992. 1994. 1996. 1998. 2000. 2002. 2004. 2006. Number of Tuberculosis Cases: California, 1930-2006. Number of Tuberculosis Cases. Number of Tuberculosis Cases and Case Rates: California, 1997-2006. Number of Cases.

E N D
1988 1980 1982 1984 1986 1990 1992 1994 1996 1998 2000 2002 2004 2006 Number of Tuberculosis Cases: California, 1930-2006 Number of Tuberculosis Cases
Number of Tuberculosis Cases and Case Rates: California, 1997-2006 Number of Cases Case Rate per 100,000 Number of Cases Case Rate per 100,000 Population
Tuberculosis Cases by Race/Ethnicity: California, 2006 American Indian/ Alaska Native 9 (0.3%) Unknown 4 (0.1%) Black 208 (7.5%) White 267 (9.6%) Asian/Pacific Islander 1,223 (44.0%) Hispanic 1,068 (38.4%)
Tuberculosis Case Rates by Race/Ethnicity: California, 1997-2006 Asian/Pacific Islander Cases per 100,000 Black Hispanic American Indian/Alaska Native White
Tuberculosis Cases in Foreign-born and U.S.-born Persons: California, 1997-2006 Percent of Cases Number of Cases
Tuberculosis Cases by Country of Origin: California, 2006 Unknown 13 (0.5%) U.S.-born 630 (22.7%) Foreign-born 2,136 (76.9%) 67 All Others 770 (36.0%) Mexico 670 (31.4%) Vietnam 269 (12.6%) Philippines 427 (20.0%)
Numberof Cases Percent of Cases Tuberculosis Cases in Persons 0-4 Years of Age: California, 1997-2006 Number of Cases Percent of Cases
Tuberculosis Cases by Verification Criteria: California, 2006 Positive Smear 13 (0.5%) Provider Diagnosis 199 (7.2%) Clinical Case 326 (11.7%) Positive Culture 2,241 (80.6%)
Died During Treatment Died Before Starting Treatment Dead at Diagnosis Percent Dying with Tuberculosis Deaths in Persons with Tuberculosis: California, 1996-2004 Percent of Cases Number of Deaths
Number of Tuberculosis Cases with AIDS Percent of Tuberculosis Cases with AIDS Tuberculosis Cases by AIDS Diagnosis*: California, 1995-2004 Number of Cases with AIDS Percent of Cases with AIDS * Match found in AIDS Case Registry, California Office of AIDS.
AIDS-associated Tuberculosis* by Race/Ethnicity: California, 1995-2004 Hispanic Black White Number of Cases with AIDS American Indian/Alaska Native Asian/Pacific Islander * Match found in AIDS Case Registry, California Office of AIDS.
Tuberculosis Cases with Multidrug-resistance (MDR) on Initial or Final Drug Susceptibility Testing*: California, 1995-2004 58 48 47 43 42 40 39 39 35 34 Number of MDR Tuberculosis Cases *Cases with resistance to at least isoniazid and rifampin reported on the Initial Drug Susceptibility Report (Follow-up 1) or on the Case Completion Report (Follow-up 2).
Tuberculosis Cases with Initial Multidrug-resistance (MDR)*: California, 2002-2006 Initial MDR Cases: 2002-2006 ³ 25 Cases 15-24 Cases 5-14 Cases 1-4 Cases None Berkeley San Francisco Pasadena Long Beach *Cases with initial drug resistance to at least isoniazid and rifampin.
Tuberculosis Cases1 by Outcome of Therapy in Reporting Jurisdiction: California, 2004 No Info 22 (0.8%) Lost3 49 (1.7%) Other 18 (0.6%) Died 183 (6.3%) Refused 10 (0.3%) Moved2 234 (8.1%) Completed Therapy >12 Months 313 (10.8%) Completed Therapy £12 Months 2,075 (71.5%) 1 Patient alive at diagnosis and started on an initial drug regimen of one or more drugs. 2 Patient moved to another jurisdiction with a known forwarding address before treatment was completed. 3 Patient could not be located prior to the completion of treatment.
Outcome in Tuberculosis Cases1 for Whom Greater than One Year of Treatment was Indicated2: California, 2004 No Information 5 (5.6%) Refused 1 (1.1%) Lost4 4 (4.5%) Completed Therapy £ 12 Months 18 (20.2%) Died 10 (11.2%) Moved3 13 (14.6%) Completed Therapy >12 Months 38 (42.7%) 1Treatment in the jurisdiction reporting the case. 2Includes cases with rifampin resistant disease, cases with meningeal disease, and cases less than 15 years of age with disseminated tuberculosis disease. 3Patient moved to another jurisdiction with a known forwarding address before treatment was completed. 4 Patient could not be located prior to the completion of treatment.
Outcome in Tuberculosis Cases1 for Whom Greater than One Year of Treatment was Indicated2: California, 2004 No Information 5 (5.6%) Refused 1 (1.1%) Lost4 4 (4.5%) Completed Therapy £ 12 Months 18 (20.2%) Died 10 (11.2%) Moved3 13 (14.6%) Completed Therapy >12 Months 38 (42.7%) 1Treatment in the jurisdiction reporting the case. 2Includes cases with rifampin resistant disease, cases with meningeal disease, and cases less than 15 years of age with disseminated tuberculosis disease. 3Patient moved to another jurisdiction with a known forwarding address before treatment was completed. 4 Patient could not be located prior to the completion of treatment.
Completed in 1 year or less Completed Completion of Tuberculosis Therapy: California,1995-2004 Note: Excludes cases with rifampin resistant disease, cases with meningeal disease, cases less than 15 years of age with disseminated tuberculosis disease, and those that died during treatment.