Download
1 / 22
370 likes | 788 Views
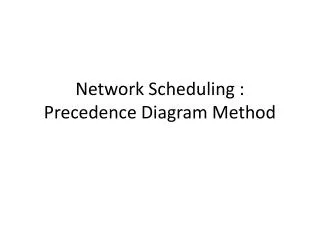
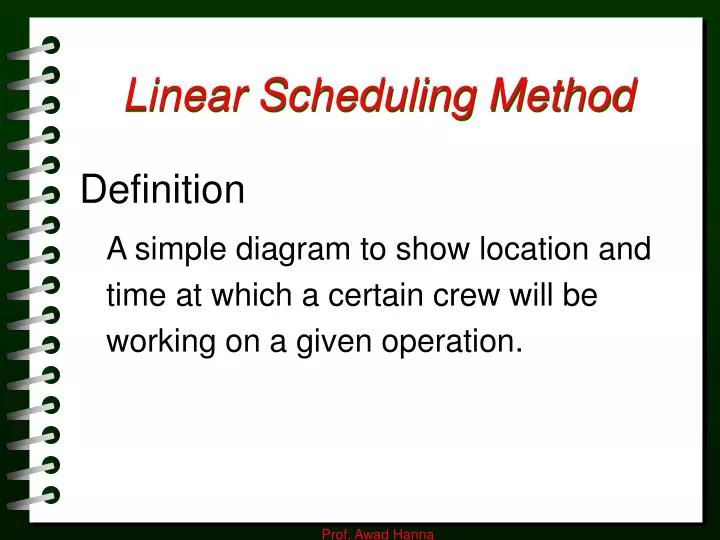
Linear Scheduling Method. Definition A simple diagram to show location and time at which a certain crew will be working on a given operation. Characteristics. Shows repetitive nature of the construction. Progression of work can be seen easily.

E N D
Linear Scheduling Method Definition A simple diagram to show location and time at which a certain crew will be working on a given operation. Prof. Awad Hanna
Characteristics • Shows repetitive nature of the construction. • Progression of work can be seen easily. • Sequence of different work activities can be easily understood . • Have fairly high level of detail. • Can be developed and prepared in a shorter time period than other formats. Prof. Awad Hanna
Advantages of LSM • Provides more information concerning the planned method of const. than a bar chart. • In certain types of projects, LSM offers some advantages over the network approach. Prof. Awad Hanna
Line of Balance Technique • LSM has relationships to the line of balance (LOB) technique, developed by US. Navy in the early 1950s. • First applied to industrial manufacturing and production control. Prof. Awad Hanna
Three diagrams are used in LOB: 1. Production Diagram Shows the relationships of the assembly operations for a single unit. Similar to AOA, except that it shows only one unit of production. 2. Objective Diagram Used to plot the planned or actual number of units produced vs. time. LSM diagram resembles this diagram. 3. Progress Diagram Shows the number of units for which each of the subassembly operations has been completed. Prof. Awad Hanna
Difference between Objective Diagram and LSM : • O.D. is used to schedule or record the cumulative events of unit completion. • LSM is used to plan or record progress on multiple activities that are moving continuously in sequence along the length of a single project. Prof. Awad Hanna
Implementation of LSM • Can be used to continuous activities rather than discrete activities. • Transportation projects; highway const., highway resurfacing and maintenance, airport runway const. and resurfacing, tunnels, mass transit systems, pipelines, railroads. • High-rise building construction • Repetitive building units Prof. Awad Hanna
Elements of the LSM • Axis Parameters • Location • Measure of progress. • In high-rises and housing const., measures may be stories, floors, subdivisions, apartments, housing units • In Transportation projects, distance (ft. or mile can be used, but division by stations (100ft.) is common) is general. Prof. Awad Hanna
Time • Hours, days, week, or month - depends on the total project time and level of detail desired in the schedule. • Preferable to prepare the schedule based on working days and convert to calendar days only at the end. Prof. Awad Hanna
Activity Production Rates • Obtained by the usual estimating methods as a function of the activity, equip. characteristics, labor, and job conditions. • The initial rate should be associated with the min. direct cost of accomplishing the single activity. Prof. Awad Hanna
Activity Interruption and Restraint • Prod. rate may vary with locations or time periods. • Progress may be interrupted intentionally and restraints may occur between activities due to limited equip. or crews. Prof. Awad Hanna
Buffers • When const. activities progress continuously in a chain, some spacing between activities is required. • This spacing serves as a buffer and may be required distance or time interval between activities. Prof. Awad Hanna
Activity Intervals • Used to describe the period of time between the start and finish of an activity at a particular location. • Intervals can be indicated by broad line, two narrow lines, etc. • Monitoring Progress • Working or calendar can be marked with a moving symbol or a line, tape, etc. vertically across the diagram. • Progress on individual activities would be marked by location rather than time. Prof. Awad Hanna
1. Project Time Optimization • The total project time may be such that indirect costs and liquidated damages assessed are more costly than the expense of accelerating certain activities. • Cost-duration analysis can be used to minimize the total cost, as follows : Prof. Awad Hanna
a) Identify all activities that can be accelerated or decelerated. b) Among the above, consider only those that are at a buffer limitation at both the start and the finish of the activity. c) Of these, select the one activity with the lowest cost slope associated with acceleration (or deceleration). d) Accelerate (or deceleration) the activity rate of production the maximum feasible amount. e) Repeat the above steps successively until the optimum project cost and associated duration is obtained. Prof. Awad Hanna
2. Discrete Activities Discrete are best scheduled by other methods. Once the duration is determined by network analysis, it can be scheduled on the LSM diagram and coordinated with the linear activities. 3. Seasonal Adjustments When developing LSM, appropriate adjustments can be made for seasonal effect on construction progress. Prof. Awad Hanna
4. Project Progress and Resource Management • Project progress is often estimated by the S-curve when bar chart development. • In LSM, the determination of activity progress is facilitated and made more rigorous. Prof. Awad Hanna
LSM Schedule 4 Excavate Fnds 3 F & P Fnds & Slab 2 Frame 1 2 4 6 8 10 12 14 16 18 20 22 24 Prof. Awad Hanna
LSM Schedule with Brickwork 4 Excavate Fnds 3 F & P Fnds & Slab Frame 2 1 Brickwork 2 4 6 8 10 12 14 16 18 20 22 24 Buffer Prof. Awad Hanna
Four-unit Duplex I-J Fragnet 2 EXC FNDS BLDG 1 7 F&P FNDS & SLAB BLDG 1 8 FRAME BLDG 1 2 EXC FNDS BLDG 2 7 F&P FNDS & SLAB BLDG 2 8 FRAME BLDG 2 2 EXC FNDS BLDG 3 7 F&P FNDS & SLAB BLDG 3 8 FRAME BLDG 3 2 EXC FNDS BLDG 4 7 F&P FNDS & SLAB BLDG 4 Prof. Awad Hanna
LSM Schedule 4 3 Duplex Number 2 Excavate Foundations 1 2 4 6 8 10 12 14 16 18 Days Prof. Awad Hanna
LSM Schedule 4 3 Duplex Number F&P Foundations & Slab 2 Excavate Foundations 1 2 4 6 8 10 12 14 16 18 Days Prof. Awad Hanna