Download

1 / 2
20 likes | 47 Views
There are number of technical indicators implemented to serve the different purposes in the field of trading. Out of many, MACD is frequently used indicator.

E N D
Multiply Your Profits Multiply Your Profits With The Use Of Moving With The Use Of Moving Average Convergence/ Average Convergence/ Divergence Divergence Technical analysts use indicators and oscillators to gauge the market trend and price of the stocks. There is a number of technical indicators implemented to serve the different purposes in the field of trading. Out of many, Moving Average Convergence/ Divergence has frequently used indicator.
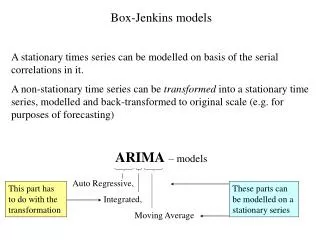
MACD stands for moving average convergence and divergence. The Gerald Appel developed it. MACD is based on differences between the two moving average of different lengths. Difference between the fast and slow moving averages are taken into consideration. A second line of the MACD represents the moving average in the chart is called signal” line. There is also a third line in the chart. That is drawn optionally. It represents the histogram of the difference between the MACD and the signal line. Therefore, this third line is known as MACD histogram. MACD is implemented to generate the accurate stock future tips, stock trading tips, and stock cash tips. Money Classic Research is one of the leading advisory firms. It has highly experienced technical team. However, there are some technical analysts and even experienced traders implement two or more technical indicators at the same time. The reason for doing this is to generate the exclusive and best signals of buying and selling of stocks. The most common combination of the indicators used together to generate the accurate tips and predict the market trend is RSI and MACD. Where RSI is abbreviation used for relative strength index and MACD stands for Moving Average Convergence/ Divergence. Both the indicators are fundamental oscillating indicators. In this article, the working of both the indicator simultaneously is explained. For some readers, execution of RSI and MACD indicator at the same time may sound strange. However, as we all know whether trader uses the technical indicator one at a time or uses two or more indicator then also nothing works 100% precisely.