Download
1 / 13
140 likes | 590 Views
Why calculate slope and Aspect?. S tudy the flow of water I dentify the habitats of plants Identify potential sites for urban growth D rainage patterns on digital elevation models (DEMs) E nvironmental modeling. Slope.

E N D
Why calculate slope and Aspect? Study the flow of water Identify the habitats of plants Identify potential sites for urban growth Drainage patterns on digital elevation models (DEMs) Environmental modeling
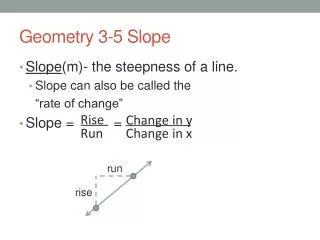
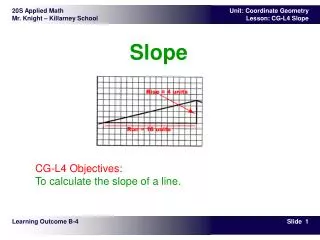
Slope • Slope measures the steepness of the surface at any particular location. • Slope is often measured in degrees or in percent rise
Aspect • Aspect measures the direction of steepest slope for a location on the surface. • It is usually measured in degrees, where 0 degrees is due north, 90 degrees is due east, 180 degrees is due south, and 270 degrees is due west.
Raster based GIS grid model • Using the elevations of the surrounding eight points in a 3 x 3 neighborhood. • To calculate the slope and aspect for cell “F” needs elevations at point A, B, C, G, K, J, I, E
Calculate east-west gradient: • ∆X = ((ZC + 2*ZG +ZK) – ZA+2*ZE+ZI))/8*cell size • Calculate north-south gradient: • ∆Y= ((ZA + 2*ZB +ZC) – ZI+2*ZJ+ZK))/8*cell size
Slope & Aspect tan(Slope(F)) = squrt((∆x)2+ (∆Y)2) tan(Aspect(F)) = ∆x / ∆Y
Aspect Aspects indicate the steepest downslope direction Aspects are measured clockwise
Hydrologic Slope- Direction of Steepest Decent • Assign a flow direction to each grid cell based on the neighboring cell with the lowest elevation.
Flow Directions Eight Direction Pour Point Model Elevation Grid Flow Direction Grid
Flow Accumulation • Flow accumulation is calculated from flow directions. • It calculates the number of grid cells drain into an individual grid cell.
Flow Accumulation • The flow accumulation grid has a value for each cell that represents the number of the number of cells upstream from that cell. • Cells with higher values will be located in drainage channels rather than hillsides or ridges.
Watershed Delineation • Watersheds are delineated from the flow direction layer. It is the area flowing into a given outlet or pour point.
Stream network delineation • Flow accumulation threshold value defines the minimum or number of cells drainage area upstream necessary to define a stream. Cell size = 100 x 100 m Each cell represents 10,000 m2 in area. If delineate the streams for a 10,000 cell flow accumulation threshold, the minimum drainage area upstream will be: 10,000 x 10,000 = 100,000,000 m2 or 100 km2