Download
1 / 24
240 likes | 601 Views
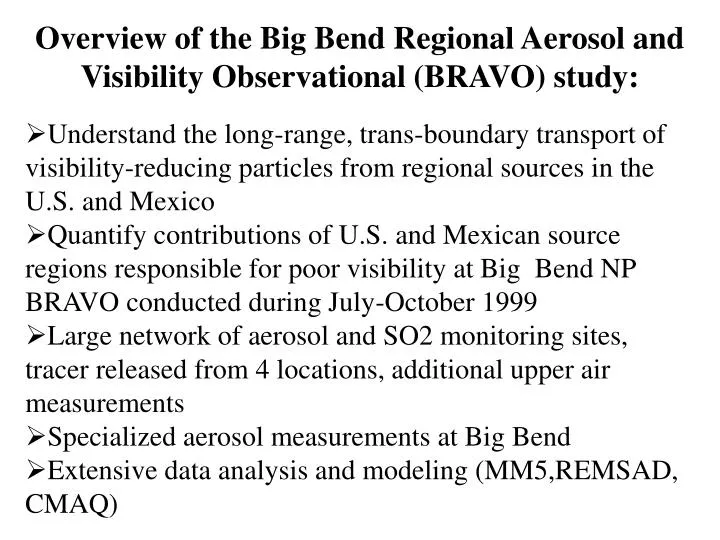
Overview of the Big Bend Regional Aerosol and Visibility Observational (BRAVO) study: Understand the long-range, trans-boundary transport of visibility-reducing particles from regional sources in the U.S. and Mexico

E N D
Overview of the Big Bend Regional Aerosol and Visibility Observational (BRAVO) study: • Understand the long-range, trans-boundary transport of visibility-reducing particles from regional sources in the U.S. and Mexico • Quantify contributions of U.S. and Mexican source regions responsible for poor visibility at Big Bend NP BRAVO conducted during July-October 1999 • Large network of aerosol and SO2 monitoring sites, tracer released from 4 locations, additional upper air measurements • Specialized aerosol measurements at Big Bend • Extensive data analysis and modeling (MM5,REMSAD, CMAQ)
BRAVO aerosol and tracer monitoring sites and tracer release locations
Tracer transport • Eagle Pass tracer > detection limit at the 6 hour sites 16% to 59% of the time (most frequently at northern sites) • Timing tracers from Eagle Pass indicated transport times most often 12-18 hours • Northeast Texas and Houston area tracers hit 6 hour sites infrequently and tends to hit all sites during an episode (broader plume) • San Antonio tracer > detection limits 15% to 34% of the time with several periods of short-term impacts at most or all sites
4 major episodes, 2-4 days duration Sulfate scattering dominated extinction
Some findings • Sulfates dominated fine mass budget, followed by carbon, crustal • Secondary organics identified as important by organic speciation, but could not be apportioned • Some periods of African dust (July, August) identified from calcium deficiency, backtrajectories • Spatial pattern analysis (TAGIT) of SO2 and SO4 near Big Bend attribute 75% of SO2 to “local” sources and 90% of SO4 to “regional” sources
HYSPLIT Residence time for entire BRAVO study-flow mostly from SE along border area Residence time worst 20% light scattering (6-hour periods) flow more from NE prior to along border area
Weak cold front passes through area, bring flow from the NE behind front-episode 3
Conceptual model for late summer/early fall haze episodes at Big Bend • Weak early season cold front approaches Texas • SE flow ahead of front brings emissions from sources in east Texas/Gulf Coast inland under humid conditions • Northeast-east flow after frontal passage carries polluted airmass toward Big Bend • Flow returns to typical SE as it approached Big Bend, also carrying emissions from border area • Absolute worst-case had “back-door cold front approach from NE, carrying sulfur compounds from eastern US in additional to regional and local emissions
Preliminary Particulate Sulfur Source Attributions for BRAVO by Trajectory Mass Balance Regressions- Kristi Gebhart, NPS
Preliminary Source Attributions from Trajectory Mass Balance Regressions • Carbon I/II – 0 - 18% • East Texas – 36 - 42% • Monterrey Region, Mexico City & Volcano – 20 - 30% • El Paso Region – 0 - 7% • Eastern U.S. – 0 - 7% • Western U.S. – negligible
Air Quality modeling • MM5 with 36 and 12 km grids entire 4 months, 4 km near Big Bend two 10-day episodes • CMAQ for two 10-day episodes • REMSAD for entire 4 months (36 km and 12 km)
Big Brown tracer and Observed S Big Brown tracer August- Particulate S and observed iPPCH Observed S
August- CMAQ and observed iPPCH 12km CMAQ and 36km REMSAD Big Brown tracer obs/preds time series for sequestered period Look at CMAQ first… Obs Preds
August- REMSAD and observed iPPCH 12km CMAQ and 36km REMSAD Big Brown tracer obs/preds time series for sequestered period Now REMSAD… Obs Preds
Houston tracer and observed S Houston tracer October- Particulate S and observed PTCH Observed S
October- CMAQ and observed PTCH 12km CMAQ and 36km REMSAD Houston tracer obs/preds time series for sequestered period Look at CMAQ first… Obs Preds
12km CMAQ and 36km REMSAD Houston tracer obs/preds time series for sequestered period October- REMSAD and observed PTCH Now REMSAD… Obs Preds
REMSAD PTCH REMSAD vs. CMAQ 36 km vs. 12 km PTCH (Houston Tracer) October 12 Graphics from AER 36 km 12 km
SO4 at K-BAR, August-October 1999 from CIRA
Modeling status • Modeling work is on-going • Additional work being done (CMAQ at 36 km, etc.) to help understand CMAQ transport problems • REMSAD and CMAQ sensitivity tests to assess contributions to sulfate from Mexico, east Texas, west Texas, non-Texas US areas