Download
1 / 29
480 likes | 1.75k Views
Regional Floods. Mississippi River System Carries sediment to sea and deposits in Birdfoot delta lobe in Gulf of Mexico. Figure 14.21. Regional Floods. Mississippi River System River builds up channel bottom over time, until channel bottom is higher than surrounding floodplain

E N D
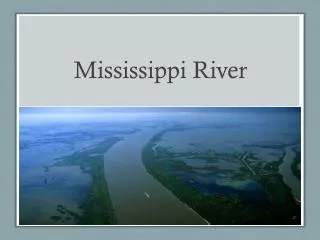
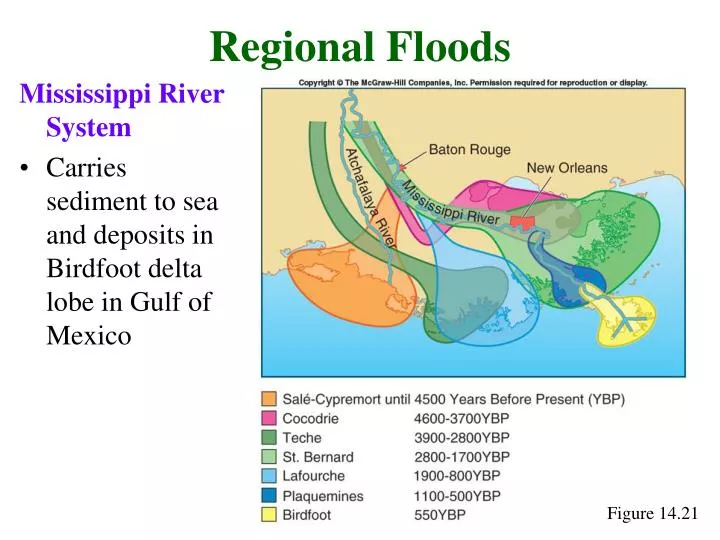
Regional Floods Mississippi River System • Carries sediment to sea and deposits in Birdfoot delta lobe in Gulf of Mexico Figure 14.21
Regional Floods Mississippi River System • River builds up channel bottom over time, until channel bottom is higher than surrounding floodplain • Avulsion in next major flood: river adopts new, lower elevation channel, andabandons old channel • Lobes of Mississippi River delta represent different avulsions • Mississippi River overdue for avulsion – current channel unstably high (above downtown New Orleans) • Should undergo avulsion to channel of Atchafalaya River • U.S. Army Corps of Engineers (instructed by Congress) allows 30% water down Atchafalaya, 70% water down Mississippi
Regional Floods Mississippi River System – Some Historic Floods • New Orleans’ first large flood in year of founding, 1717 • Built levees to prevent future flood – same response in place today • Continuous efforts to build levees to prevent flooding result in more destruction in next flood when levees fail • 1927 floods breached levees in 225 places, killed 183 people • 1973 floods extended along 1,930 km of river, inundating 50,000 km2
Regional Floods Mississippi River System – The Great Midwestern Flood of 1993 • Biggest flood in 140 years – more than 20 million acres • Wet winter, spring even wetter summer, caused by low pressure from bend in jet stream • Record flood levels on lower Missouri and upper Mississippi Rivers from April to August • More than 160 consecutive days of flooding in some towns • Did not significantly affect lower Mississippi River – low flow from Ohio River
Regional Floods Mississippi River System – The Great Midwestern Flood of 1993 Figure 14.22
Regional Floods Mississippi River System – Weather Conditions • Biggest floods in 1927, 1973, 1993 • Each case: wet preceding autumn and winter, saturated ground for spring, followed by wet summer, caused by low pressure from bend in jet stream • Reasonably common occurrence Figure 14.24
Regional Floods Mississippi River System – Role of Levees • Long use of levees transformed Mississippi into restricted ribbons of water, cutting off floodplains • Flooded channels can not spread laterally – forced to rise vertically until levees are overtopped • St. Louis flood would have crested 4 m lower without levees • Apparent protection of levees encourages more development on floodplains
Regional Floods Mississippi River System – Role of Levees • Saturated levees can be compromised by wave attack, erosion by overtopping, failing by slumping, undermining by piping Figure 14.25
Regional Floods Mississippi River System – Role of Levees • 1993 flood: • 1,083 of 1,576 levees were overtopped or damaged • Floodwaters reoccupied more than 20 million acres • Entire state of Iowa and sections of North Dakota, South Dakota, Minnesota, Wisconsin, Illinois, Missouri, Nebraska, Kansas declared federal disaster area • 48 people killed • 75 towns completely submerged • 50,000 homes destroyed or damaged • 12 commercial airports closed • 4 interstate highways closed • $12 billion damage
Regional Floods China • Attempts to control Yellow River go back to 2356 B.C.E. • In last 2,500 years, river has undergone ten major channel shifts moving location of mouth up to 1,100 km • Sediment deposition on channel floor builds up channel in elevation eventually may behigher than surrounding floodplain • During next flood river may adopt lower elevation course outside of old banks avulsion • 1887 avulsion sent Huang River south to join Yangtze River, with floods that resulted in over 1 million deaths • 1938 dynamiting of levees resulted in 1 million deaths
Regional Floods China • Huang River today is20 m higher than adjacent floodplain – kept in place by levees Figure 14.28 Figure 14.29
Societal Responses to Flood Hazards • Structural responses: • Dam construction • Building levees • Straightening, widening, deepening and clearing channel to increase water-carrying ability • Sandbagging • Nonstructural responses • More accurate flood forecasting • Zoning and land-use policies • Insurance programs • Evacuation planning • Education
Societal Responses to Flood Hazards Dams • Dam construction to create reservoirs gives sense of protection from floods, but dams do not control floods • Life spans of dams are limited by construction materials, construction style, rate at which sediment fills reservoir • Major floods occur downstream due to • Overtopping • Heavy rainfall below dam • Dam failure • 1981 study of dam safety by Army Corps of Engineers: • 2,884 of 8,639 dams unsafe
Societal Responses to Flood Hazards Levees • Cost of building levees may be more than value of structures intended to protect • Sense of security encourages further development of floodplain • Research shows that peak floodwater heights increased 2 to 4 m (for same water volume) in last 150 years in upper Mississippi River sections with levees and engineered channels, while staying the same on unengineered upper Missouri River • Floods in St. Louis crested at 11.6 m in 1903, 15.1 m in 1993 for same water volume
Societal Responses to Flood Hazards Sandbagging • Temporary levees of bags of sand and mud • Estimated about26.5 million sandbagsused in 1993 floods • Lessened damage some places, but not others – therapeutic value Forecasting • Forecasts of height and timing of regional floodwaters have significantly reduced loss of life • Do not offset ever-greater damages, losses Zoning and Land Use • National Flood Insurance Program, FEMA: ban building on floodplain covered by 100-year flood • Discourages construction at frequently flooded sites but does not prevent all flooding of structures
Societal Responses to Flood Hazards Insurance • Flood insurance available from National Flood Insurance Program since 1950s, rarely purchased • Of 10,000 flooded households in Grand Forks, North Dakota in 1997,only 946had flood insurance • $300,000 media campaign by FEMA 73 householdsbought flood insurance • U.S. Congresscomes to rescue – 1993 flood victims received$6.3 billionbill providing aid Presidential Disaster Declarations • “Such severity and magnitude that effective response is beyond the capabilities of the state and the affected local governments” • Disastrous floods caused 45% of PDDs in 51 years
Urbanization and Floods Hydrographs • Plots volume of water (or stream depth) against time • Time lag after rainfall for runoff to reach stream channel, then stream surface height rises quickly (steep rising limb of hydrograph) • Stream level falls more slowly as underground flow of water continues to feed stream (gently sloped falling limb of hydrograph) Figure 14.31
Urbanization and Floods • Urbanization changes shape of hydrograph, making curve much steeper • Good news: urban flood might only last 20% as long • Bad news: urban flood could be four times higher Figure 14.32
Urbanization and Floods Flood Frequencies • Urbanization increases surface runoff of rainwater higher stream levels in shorter times (flash floods) Figure 14.33
Urbanization and Floods Channelization • Try to control floodwaters by making channels clear of debris, deeper, wider and straighter • Push stream into “too much discharge” case • Stream response to regain equilibrium: erodes bottom and banks to pick up sediment and decrease gradient
Urbanization and Floods The Extreme Approach: Los Angeles • Cleared, straightened and deepened river channels – also lined with concrete, to reduce friction and speed up flow • While flood volumes are smaller than channel capacity no urban floods • Dangerous if anyone falls into channel with racing floodwaters • Obliterates habitat of riverine plants and animals, “soul” of community Figure 14.34
Urbanization and Floods The Binational Approach: Tijuana and San Diego • Tijuana River passes through Tijuana, Mexico, then through San Diego, California on way to Pacific • U.S. and Mexico agreed to construct concrete channel for river • U.S. backed out after Mexico constructed channels • High-velocity floods from Mexican channels inundate open farms and subdivisions of southern San Diego Figure 14.35
Urbanization and Floods The Uncoordinated Approach: San Diego • Army Corps of Engineers constructed 245 m wide channel at mouth Figure 14.36
Urbanization and Floods The Uncoordinated Approach: San Diego • Mission Valley was developed along natural channel, 7.5 m wide • Part of Mission Valley has 110 m wide channel feeding into natural channel Figure 14.37
Urbanization and Floods The Hit-and-Miss Approach: Tucson • Flooding of Santa Cruz River in 1983 was 1.76 times bigger than FEMA estimates of 100-year flood • Six of seven largest floods were between 1960 and 1983, during years of peak city growth and urbanization • Desert floods damage by bank erosion, not inundation • Some Tucson stream banks moved laterally more than 300 m, so that 100-year floodplain moved also • Protective walls concentrate erosion at end of wall • Metropolitan Tucson Convention and Visitors Bureau: “The 100-year flood has come and gone, so, by all rights, Tucsonians should enjoy another century of great southwestern weather.”
The Biggest Floods Ancient Tales of Deluge • Tales of ancient floods are part of many cultures • Are these floods larger than those today, or 1,000-year floods? • Flooding of fertile ground adjacent to rivers (floodplains) where entire ancient cultures thrived would have seemed like flooding of “whole world” Figure 14.40
The Biggest Floods Ice-Dam Failure Floods • Biggest floods during melting of continental ice sheets lakes behind ice dams that failed suddenly • Evidence of flood from Lake Missoula after melting of ice dam: • Lake sediments • Land stripped of soil, sediment cover • High-elevation flood gravels • Integrated system of braided channels • Abandoned waterfalls • High-level erosion • Large-scale sediment deposits Figure 14.41
The Biggest Floods Ice-Dam Failure Floods • Huge volume of meltwater: • Changed paths of rivers • Could change global circulation of deep ocean water change in global climate • About 12,900 years ago, climate cooled about 5oC (Younger Dryas), possibly by gigantic meltwater flood through St. Lawrence River into North Atlantic Ocean • Largest known floods in Earth history, raising sea level by about 130 m Figure 14.42 Figure 14.43