Download
1 / 39
390 likes | 677 Views
Earthquake Preparedness and Countermeasures in Osaka Municipal Waterworks Bureau. Osaka Municipal Waterworks Bureau Kazuya YAMANO. Osaka Municipal Waterworks. Purification plants: 3 plants Distribution pipes: 5,000 km

E N D
Earthquake Preparedness and Countermeasures in Osaka Municipal Waterworks Bureau Osaka Municipal Waterworks Bureau Kazuya YAMANO
Osaka Municipal Waterworks Purification plants: 3 plants Distribution pipes: 5,000 km Water supply capacity: 2,430,000 m3/day Area: 211km2 Population:2.6 million OSAKA City Kobe City Japan OSAKA Municipal Waterworks Bureau
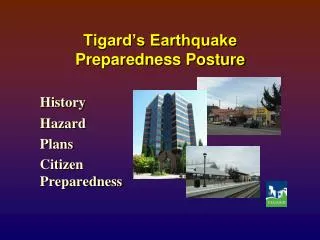
Outline of Earthquake Preparedness Efforts Kobe Earthquake (1995) Earthquake Preparedness Improvement Plan 21(1996) Review of scenario earthquakes (2004~) Investigation of seismic motion Tsunami Estimation Estimation Improving earthquake preparedness Damage of distribution pipes Influence on purification plants OSAKA Municipal Waterworks Bureau
Outline of Earthquake Preparedness Efforts Kobe Earthquake (1995) Earthquake Preparedness Improvement Plan 21(1996) Review of scenario earthquakes (2004~) Investigation of seismic motion Tsunami Estimation Estimation Improving earthquake preparedness Damage of distribution pipes Influence on purification plants OSAKA Municipal Waterworks Bureau
Osaka Municipal Waterworks Earthquake Preparedness Improvement Plan 21 8 Basic Elements • Improving Earthquake Resistance of Key Facilities • Establishing a Water Supply and Distribution Center Network • Improving Compatibility among Different Distribution Systems • Countermeasures against Power Failure • Expanding Emergency Material Stock System • Establishing Stable Water Supply Routes to Man-made Islands • Improving Reliability of Information and Communication System • Improving Earthquake Resistance of Headquarters Necessary for Disaster Relief and Recovery Activities OSAKA Municipal Waterworks Bureau
Earthquake Preparedness (1) Improving earthquake resistance of distribution pipe network Length of cast iron pipes 1,278 km (1997) 870 km (2005) Ductile Iron Pipe OSAKA Municipal Waterworks Bureau
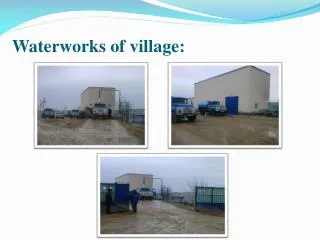
Sakishima Distribution Plant SAKISHIMA Nagai Distribution Plant NAGAI Earthquake Preparedness (2) Increasing capacity of drinking water reservoirs Capacity of distribution reservoir Nagai : 42,000 ㎥ KUNIJIMA Sakishima : 30,000 ㎥ Total : 72,000 ㎥ UP JOTO OYODO OTEMAE TATSUMI MINATO Osaka City SUMIYOSHI SUMINOE Distribution Plant (existing) Distribution Plant (newly-built) OSAKA Municipal Waterworks Bureau
Earthquake Preparedness (3) Sufficiency of emergency materials Water Supply Truck Polyethylene Bag (3L, 10L) Pipe Stock Temporary Water Tank(4m3) OSAKA Municipal Waterworks Bureau
Earthquake Preparedness (4) Realization of effective emergency activity Disaster InformationManagement System Headquarters Instructions Report Disaster Site OSAKA Municipal Waterworks Bureau
Outline of Earthquake Preparedness Efforts Kobe Earthquake (1995) Earthquake Preparedness Improvement Plan 21(1996) Review of scenario earthquakes (2004~) Investigation of seismic motion Tsunami Estimation Estimation Improving earthquake preparedness Damage of distribution pipes Influence on purification plants OSAKA Municipal Waterworks Bureau
Scenario Earthquakes (c) (b) (a) (d) (a) Uemachi fault (b) Ikoma fault (c) Arima-Takatsuki-kozosen fault (d) Chuo-kozosen fault (e) Nankai trough (Tonankai-Nankai Earthquake) Tsunami (e) OSAKA Municipal Waterworks Bureau
Outline of Earthquake Preparedness Efforts Kobe Earthquake (1995) Earthquake Preparedness Improvement Plan 21(1996) Review of scenario earthquakes (2004~) Investigation of seismic motion Tsunami Estimation Estimation Improving earthquake preparedness Damage of distribution pipes Influence on purification plants OSAKA Municipal Waterworks Bureau
Japan Kobe Osaka Tonankai Nankai Tonankai & Nankai Earthquake (1) Earthquake Occurrence Probability (within next 30 years) - Tonankai Earthquake : about 60% - Nankai Earthquake : about 50% Scenario Earthquake Committee on Tonankai & Nankai Tsunami OSAKA Municipal Waterworks Bureau
Japan Kobe Osaka Tonankai Nankai Tonankai & Nankai Earthquake (2) Earthquake Occurrence Probability Scenario Earthquake - Simultaneous Occurrence of Tonankai & Nankai Earthquakes - JMA Magnitude : 8.4 Committee on Tonankai & Nankai Tsunami OSAKA Municipal Waterworks Bureau
Tonankai & Nankai Earthquake (3) Earthquake Occurrence Probability Scenario Earthquake Committee on Tonankai & Nankai Tsunami Chairperson: Prof. Kawata ( Kyoto Univ. ) Members: Osaka City, Osaka Pref., Wakayama Pref. Osaka City Making map of inundation by Tsunami Possibility of tsunami going over Yodo River Large Weir revealed Inundation map OSAKA Municipal Waterworks Bureau
Preparedness against tsunami caused by Tonankai & Nankai Earthquake Committee on the Influence on Water Treatment by Tsunami in Yodo River Examination of Intake ofKunijima purification plant along Yodo River : (2) Turbidity (1) Chloride ion Upper Flow Yodo River Intake of Kunijima P.P Yodo River Large Weir Overflow Kunijima P.P 1,180,000m3/day Lower Flow (Osaka Bay) OSAKA Municipal Waterworks Bureau
Tsunami simulation Tsunami simulation Yodo River Model of seismic source Kobe Osaka Yodo River Large Weir Japan Osaka Bay Tonankai Nankai (River flow : 196m3/s) JMA Magnitude : 8.4 Tsunami arrives at the Yodo River estuary within 2 hours and the Yodo River Large Weir within 2.5 hours after the earthquake. OSAKA Municipal Waterworks Bureau
Chloride Ion Concentration Tsunami simulation Chloride ion concentration Yodo River Kobe Osaka Intake point Adjustment gate Upper Flow Lower Flow (Osaka Bay) Maximum height of tsunami ( m ) Yodo River Large Weir Main gate Yodo River Large Weir Kema Lock Gate Adjustment gate (River flow : 196m3/s) Kema Water Gate Okawa River OSAKA Municipal Waterworks Bureau
Conclusion Time of concentration being over standards (h) At Intake point, maximumconcentration of Chloride ion is about 1,000 mg/L and maximum duration of concentration level exceeding water quality standards is about 1 hour. Necessity of preparedness against tsunami OSAKA Municipal Waterworks Bureau
Outline of Earthquake Preparedness Efforts Kobe Earthquake (1995) Earthquake Preparedness Improvement Plan 21(1996) Review of scenario earthquakes (2004~) Investigation of seismic motion Tsunami Estimation Estimation Improving earthquake preparedness Damage of distribution pipes Influence on purification plants OSAKA Municipal Waterworks Bureau
STEP1 Investigation Flow Chart Collection and organization of data relevant to seismic damage of distribution pipes STEP2 Making damage ratio equations STEP3 Damage estimation of distribution pipes based on scenario earthquakes OSAKA Municipal Waterworks Bureau
Points of the Review • Upgraded seismic damage data obtained from recent research on earthquake engineering • New estimation of the seismic damages of distribution pipes in liquefied area OSAKA Municipal Waterworks Bureau
Data Utilized (1) ◆ Previous research ◆ 【2km×2km data near seismometers (JWWA1996,1998)】 = 29 areas OSAKA Municipal Waterworks Bureau
Data Utilized (2) ◆Present research◆ Seismic Motion of Kobe Earthquake Reproduced Damage Ratio of Distribution Pipes during Kobe Earthquake = about 4,800 meshes 【250m×250m data(JWWA1996)】 OSAKA Municipal Waterworks Bureau
Damage Ratio Equation D0 = a x (PGV - b) D0 : Average Ratio of Damage (points/km) PGV : Peak Ground Velocity (cm/s) a, b : Coefficient Constant D = D0 x C1 x C2 D : Rate of Damage (points/km) C1 : Diameter Correction Factor C2 : Ground Correction Factor OSAKA Municipal Waterworks Bureau
Non-LiquefactionHalf-LiquefactionLiquefaction Classification of Liquefaction (1) Liquefaction Assessment PL-value calculated by Osaka Municipal Waterworks Bureau Liquefaction Level as Classified by JWWA OSAKA Municipal Waterworks Bureau
Classification of Liquefaction (2) ◆Liquefied Ground◆ - : cumulo-probability density function Liquefaction frequency (%) Liquefaction frequency (%) PL value PL value Relation between PL value and liquefied area Relation between PL value and liquefied area OSAKA Municipal Waterworks Bureau
2 4 【Kobe earthquake】 □ 2km mesh area data ● 250m×250m data 3 【function】 ━ Osaka(2006) ━ Osaka(1997) ━ JWWA(1998) 2 1 1 0 0 50 100 150 200 0 0 50 100 150 200 Damage Ratio Equation (Non-Liquefied Ground) <Ductile Iron Pipe> <Cast Iron Pipe> Damage ratio (points/km) Damage ratio (points/km) PGV (cm/s) PGV (cm/s) D0=0.0065 x (PGV-15) D0=0.0153 x (PGV-15) OSAKA Municipal Waterworks Bureau
【Kobe earthquake】 □ 2km mesh area data ● 250m×250m data 【function】 10 ━ Osaka(2006) ━ JWWA(1998) 10 8 8 6 6 4 4 4 2.56 2 2 0 0 50 100 150 200 0 0 50 100 150 200 Damage Ratio (Liquefied Ground) <Ductile Iron Pipe> <Cast Iron Pipe> Damage ratio (points/km) Damage ratio (points/km) PGV (cm/s) PGV (cm/s) [Reference] [Reference] Average Damage Ratio=2.56 Average Damage Ratio=4.00 OSAKA Municipal Waterworks Bureau
STEP1 Investigation Flow Chart Collection and organization of the data relevant to seismic damage of distribution pipes STEP2 Making damage ratio equations • Examining upper value of damage ratio • Examiningvalue of damage ratio in liquefied ground STEP3 Damage estimation of distribution pipes based on scenario earthquakes OSAKA Municipal Waterworks Bureau
1 Damage Estimation of Distribution Pipes 2 Simulation of Areas Affected by Water Suspension 3 Estimation of Seismic Damage to the Water Supply System Examination of Effective Earthquake Countermeasures 4 Advanced Investigation Plan OSAKA Municipal Waterworks Bureau
Thank you for your attention! OSAKA Municipal Waterworks Bureau
Vertical Two-Dimensional Box Model Depth Direction Flow Direction Cell: Move of water and suspended solid is ignored OSAKA Municipal Waterworks Bureau
Tsunami Simulation OSAKA Municipal Waterworks Bureau
Equations and Conditions (Tsunami Simulation) OSAKA Municipal Waterworks Bureau
Equations and Conditions (Calculation of the chloride ion concentration) OSAKA Municipal Waterworks Bureau
Seismic Motion & Damage of pipes Seismic Motion of Kobe Earthquake Reproduced Strongest Shaking Area Damage Ratio of Distribution Pipes during Kobe Earthquake OSAKA Municipal Waterworks Bureau
PL Value w(z) =10 – 0.5 x z z : Depth from surface F = 1 – FL (FL<1.0) 0 ( FL>=1.0) OSAKA Municipal Waterworks Bureau
Disaster Information Management System Integrated Management Support for information to citizens and Osaka City Disaster Countermeasures Headquarters Seismic damage simulation function Pipeline restoration Disaster Emergency Activities Information Management Functions Emergency water supply Facility restoration OSAKA Municipal Waterworks Bureau