Download
1 / 4
40 likes | 48 Views
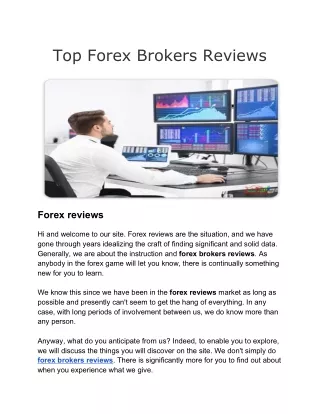
A trader should have a good understanding of top forex indicators and how to use them in their favour. These can be, many times, confusing & daunting for the investors to use the trading tools. The most common mistake that traders make while using technical indicators are using more than three tools on the price chart, thus, overloading and making it hard for people to make choices. Second, many beginners rely solely on technical analysers and forget that these tools only show a picture of the market and do not predict the future. Third and the last, do not blame the indicators when a trade does not make a profit or work out in your favour. No matter how useful the tool is, one still needs to face losses. <br><br>

E N D
5 Top Forex Indicators for Beginners fxreviews.best/blog/5-top-forex-indicators 5 Top Forex Indicators for Technical Analysis 2021 A trader should have a good understanding of top forex indicators and how to use them in their favour. These can be, many times, confusing & daunting for the investors to use the trading tools. The most common mistake that traders make while using technical indicators are using more than three tools on the price chart, thus, overloading and making it hard for people to make choices. Second, many beginners rely solely on technical analysers and forget that these tools only show a picture of the market and do not predict the future. Third and the last, do not blame the indicators when a trade does not make a profit or work out in your favour. No matter how useful the tool is, one still needs to face losses. Type of Indicators The technical indicators are majorly categorised into two types: 1. Indicators for Trending Market: A trending market is when the price line of an asset is going in one direction, either upwards or downwards. 2. Indicators for Ranging Market: A range-bound market is when the price is moving downwards and upwards, in a specific range. It is also called “sideways market”. 1/4
All the available indicators in the market are suited for either of them. Here, we’ll study the top forex indicators for technical analysis to help beginners start their trading journey with gains. Top Forex Indicators for Technical Analysis RSI: Relative Strength Index or RSI is used to compare the magnitude of gains to losses to determine oversold or over purchased conditions a trading asset. The tool, RSI, ranges from 0 to 100 and the asset is believed to be oversold when the price line hits the RSI 30 mark, and therefore, is likely to rise back in the upward trend. Similarly, the product is overbought when the RSI crosses the 70 levels and is likely to reverse towards the downtrend. A trader should also be aware that massive rallies affect the RSI and thus might give false buying or selling signals. Further, if the Relative Strength Index is combined with other tools, like MACD, the results are much better. MACD: MACD is a popular technical analyser and involves two moving averages of different time frames. For a long term trader, the most common time frames are 50 days MA and 200 days MA, while for short term or intraday traders, 30 minutes and 4 hours chart are most popular. The two exponential Mas used are used to measure the momentum and is defined by the distance between them. Additionally, the convergence and divergence in MACD (moving average convergence divergence) means both averages moving closely and going apart from each other, respectively. When the “short days moving average” crosses the long days MA, the price is anticipated to fall in the coming times. Similarly, when the long term MA falls below the short term MA, the trader should short sell the asset. Bollinger Bands: As the name suggests, the tool involves two bands and one moving average line in between the bands. These bands denote the deviation away from the middle line and thus showing the volatility in the market. The Bollinger bands adjust themselves based on current market trends. The length between the bands moves further from the MA line as the price becomes more volatile and vice versa if the volatility is stable. Technical traders assume the contraction between the bands as an early sign of high volatility in the market and the tool uses standard deviation as the base mathematical calculation. Usually, the price line remains between the bands, but when the price starts to touch the edge of the bands, it is an early sign of trend reversal. Note that the price touching the lower band shows oversold and the upper band is used to indicate an overbought market. Super Trend Indicator: Super trend indicator is a trend predicting tool and can be used as a trading system for trend following traders. The most common method to use the tool is to enter the market after a pullback. For example, if the price chart is in a 2/4
downtrend, denoted by a green line, then the trader should for the green pullback and enter the market, short selling the asset, as soon as possible. The same methodology applies to the rising market. Confluence: Confluence is not a new indicator but the combination of several technical indicators and uses their trading signals to get better results. The method is useful in eliminating the false signals by technical indicators, which is a common problem among day traders. Applying two-three technical tools simultaneously would mitigate the risk and give a better picture. The most famous combination is RSI, MACD, and Bollinger bands. Top 3 Forex Brokers for Technical Analysis Global TradeATF: Global TradeATF is a Belize based trading website that operates under the firm Bayline Trading ltd, which is a registered investment company. The firm is licensed with the top financial body, CySEC (Cyprus Securities & Exchange Commission), having license number 000188/91. Besides, the firm offers several trading products & services that includes currencies, stocks, crypto, commodities, and indices, totalling the count to 350+ financial instruments. Some of the top features provided by the Global TradeATF broker are high margin trading, MT4 trading platforms, three account types, good customer service, and impressive research library. Apart from it, the broker also has a dedicated educational page that offers webinars, seminars, guides, courses, e-books, and articles. You can deposit your funds through the firm’s robust payment services that include bank transfer, debit/credit cards, and e- Wallets like Skrill & Neteller. Oinvest: Oinvest is a brand name of BASFOUR (Forex) 3773, which is a private limited regulated proprietary investment company, with license number 2010/002719/07 siutated at South Africa. The firm is a 2018 started company providing trading products and services at reasonable rates. The brokerage organisation provides several services like tight spreads, a wide range of products, three account types, MT4 platform, an impressive research library, and high leverage service. The minimum deposit with the firm is $250, offering demo and Islamic accounts for dedicated users too. Apart from it, there are several other payment methods available for users. The investment company’s headquarter is situated at Orion Mall, Palm Street, Victoria, Mahe. You can contact the Oinvest team via telephone, email, or contact us form, from Monday to Friday. 3/4
T1Markets: T1Markets is a Cyprus headquartered trading site which works under the investment firm, General Capital Brokers Ltd. (GCB), a Republic of Cyprus registered organisation bearing registration number HE 345774. The firm provides trading services & products to users at low-cost rates through majorly three account types, namely Silver, Gold, and Platinum. Further, other top facilities offered by T1Markets are free demo account, dedicated account manager, Free VPS service, education library, news, and many more. One can connect with T1Markets executives broker 24/5, from Monday to Friday, through telephone, email, or live chat feature. Notably, the client’s funds are secure with T1Market broker’s high tech advancements, including end level encryption and SSL. The Bottom Line So, these were the top forex indicators to trade for beginners. Although all the forex indicators sound easy to use and straightforward, these become hard & complex when applying them in real-time trading. Some excellent ways to avoid the problem are practice and to enhance your knowledge & skill base. All the above-listed brokers offer free demo account service to test their services and your trading style. Besides, the broker has a dedicated education page that offers top material & content like e-Books, journals, articles, videos, webinars, seminars, and courses. The content is suitable for beginners and professionals providing easy UI/UX. 4/4